

Mathematics, 19.11.2020 01:30, dwarfarmy99
PLEASE HELP ME. Stella's teacher asked her to create a graph that has the following characteristics:
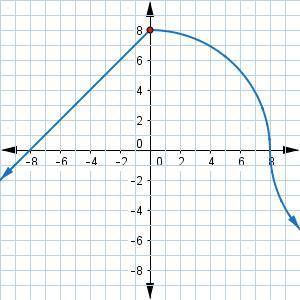
linear from x=−10 to x=0
nonlinear from x=0 to x=10
decreasing from x=−10 to x=0
increasing from x=0 to x=10
This is the graph that Stella made.
What mistake did Stella make?
She switched which sides are increasing and decreasing.
She switched which sides are linear and nonlinear.
She described the right side of the graph correctly, but the left side should be nonlinear.
She described the left side of the graph correctly, but the right side should be increasing.

Answers: 2


Other questions on the subject: Mathematics
Mathematics, 21.06.2019 15:40, dmurdock1973
What is the probability of rolling a single die greater than 4
Answers: 1
Mathematics, 21.06.2019 19:00, bellbradshaw16
Suppose that one doll house uses the 1 inch scale, meaning that 1 inch on the doll house corresponds to 1/2 foot for life-sized objects. if the doll house is 108 inches wide, what is the width of the full-sized house that it's modeled after? in inches and feet.
Answers: 2
Mathematics, 22.06.2019 01:30, alinamartinez9p752cj
Which of the following statements is a true conclusion that can be made from the scaled bargraph?
Answers: 1
Do you know the correct answer?
PLEASE HELP ME. Stella's teacher asked her to create a graph that has the following characteristics:...
Questions in other subjects:

History, 20.06.2020 05:57

Mathematics, 20.06.2020 05:57

English, 20.06.2020 05:57


