

Mathematics, 18.11.2020 20:10, sadcase85
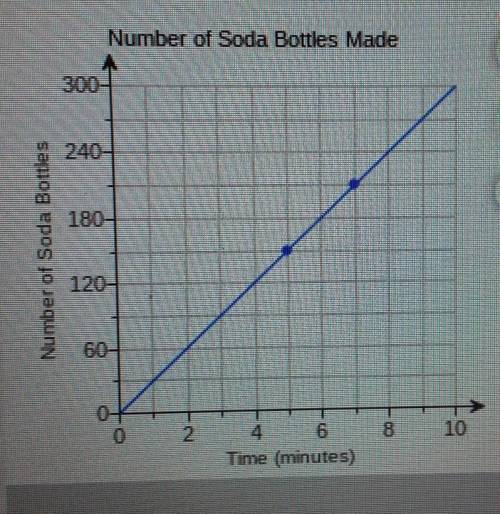
The graph shows the relationship between time and the number of soda bottles a machine can make. Use the points (5,150) and (7,210) to find the number of soda bottles the machine can make each minute.

Answers: 2


Other questions on the subject: Mathematics
Mathematics, 21.06.2019 21:30, cdvazquez727
The box plots show the average speeds, in miles per hour, for the race cars in two different races. which correctly describes the consistency of the speeds of the cars in the two races?
Answers: 3
Mathematics, 21.06.2019 23:30, sindy35111
Atown has a population of 17000 and grows at 2.5% every year. to the nearest year, how long will it be until the population will reach 19600?
Answers: 1
Do you know the correct answer?
The graph shows the relationship between time and the number of soda bottles a machine can make. Use...
Questions in other subjects:

English, 18.01.2020 02:31

History, 18.01.2020 02:31

Mathematics, 18.01.2020 02:31
History, 18.01.2020 02:31


