

Mathematics, 18.11.2020 17:50, erenackermanlevijaeg
Using the image below, answer the following questions. Be sure to answer all 3 questions, in order.
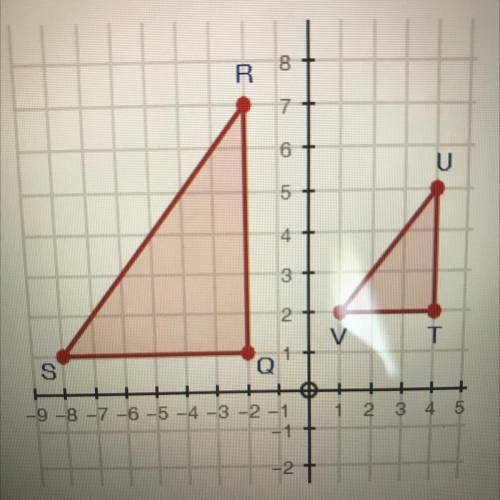
a.) Do RS and UV have equivalent slopes? Yes or No.
b.) What is the slope of VT?
c.) Name a segment that has an undefined slope. (12 points)
Triangles QRS and TUV are shown. Q is at negative 2, 1. R is at negative 2, 7. S is at negative 8, 1. T is at 4, 2.U is at 4, 5

Answers: 1


Other questions on the subject: Mathematics
Mathematics, 21.06.2019 18:30, mikey8510
The median of a data set is the measure of center that is found by adding the data values and dividing the total by the number of data values that is the value that occurs with the greatest frequency that is the value midway between the maximum and minimum values in the original data set that is the middle value when the original data values are arranged in order of increasing (or decreasing) magnitude
Answers: 3
Mathematics, 22.06.2019 03:00, dominiqueallen23
Describe how the presence of possible outliers might be identified on the following. (a) histograms gap between the first bar and the rest of bars or between the last bar and the rest of bars large group of bars to the left or right of a gap higher center bar than surrounding bars gap around the center of the histogram higher far left or right bar than surrounding bars (b) dotplots large gap around the center of the data large gap between data on the far left side or the far right side and the rest of the data large groups of data to the left or right of a gap large group of data in the center of the dotplot large group of data on the left or right of the dotplot (c) stem-and-leaf displays several empty stems in the center of the stem-and-leaf display large group of data in stems on one of the far sides of the stem-and-leaf display large group of data near a gap several empty stems after stem including the lowest values or before stem including the highest values large group of data in the center stems (d) box-and-whisker plots data within the fences placed at q1 â’ 1.5(iqr) and at q3 + 1.5(iqr) data beyond the fences placed at q1 â’ 2(iqr) and at q3 + 2(iqr) data within the fences placed at q1 â’ 2(iqr) and at q3 + 2(iqr) data beyond the fences placed at q1 â’ 1.5(iqr) and at q3 + 1.5(iqr) data beyond the fences placed at q1 â’ 1(iqr) and at q3 + 1(iqr)
Answers: 1
Mathematics, 22.06.2019 04:00, jaylynomalley
In a fruit survey, 300 children choose their favorite fruit out of apples, bananas, and watermelon. 150 chose apples and 90 chose bananas. what percent chose watermelon?
Answers: 1
Do you know the correct answer?
Using the image below, answer the following questions. Be sure to answer all 3 questions, in order....
Questions in other subjects:


Mathematics, 15.04.2020 21:01


Spanish, 15.04.2020 21:01


