

Mathematics, 17.11.2020 22:40, AyeSmoky
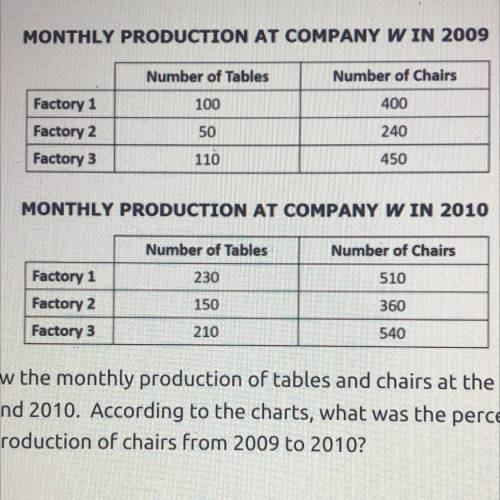
The charts above show the monthly production of tables and chairs at the three factories of
Company w in 2009 and 2010. According to the charts, what was the percent increase in
Factory 2's monthly production of chairs from 2009 to 2010?

Answers: 3


Other questions on the subject: Mathematics
Mathematics, 21.06.2019 16:00, cupcake122016
The classrooms are trying to raise $1,200.00 for charity. mrs. leblanc's class has raised 50%. mr. patel's class has raised $235.14 ms. warner's class has raised 1/3 as much as mrs. leblanc's class. how much more money is needed to reach the goal of $1,200.00?
Answers: 1
Mathematics, 21.06.2019 17:00, nataliemoore1974
Explain how you do each step what term makes it inconsistent y=2x - 4 ?
Answers: 1
Mathematics, 21.06.2019 22:00, ashhleyjohnson
After a dreary day of rain, the sun peeks through the clouds and a rainbow forms. you notice the rainbow is the shape of a parabola. the equation for this parabola is y = -x2 + 36. graph of a parabola opening down at the vertex 0 comma 36 crossing the x–axis at negative 6 comma 0 and 6 comma 0. in the distance, an airplane is taking off. as it ascends during take-off, it makes a slanted line that cuts through the rainbow at two points. create a table of at least four values for the function that includes two points of intersection between the airplane and the rainbow. analyze the two functions. answer the following reflection questions in complete sentences. what is the domain and range of the rainbow? explain what the domain and range represent. do all of the values make sense in this situation? why or why not? what are the x- and y-intercepts of the rainbow? explain what each intercept represents. is the linear function you created with your table positive or negative? explain. what are the solutions or solution to the system of equations created? explain what it or they represent. create your own piecewise function with at least two functions. explain, using complete sentences, the steps for graphing the function. graph the function by hand or using a graphing software of your choice (remember to submit the graph).
Answers: 2
Do you know the correct answer?
The charts above show the monthly production of tables and chairs at the three factories of
Company...
Questions in other subjects:


Mathematics, 19.10.2019 21:00

English, 19.10.2019 21:00

Mathematics, 19.10.2019 21:00
Mathematics, 19.10.2019 21:00


