

Mathematics, 17.11.2020 20:50, josie311251
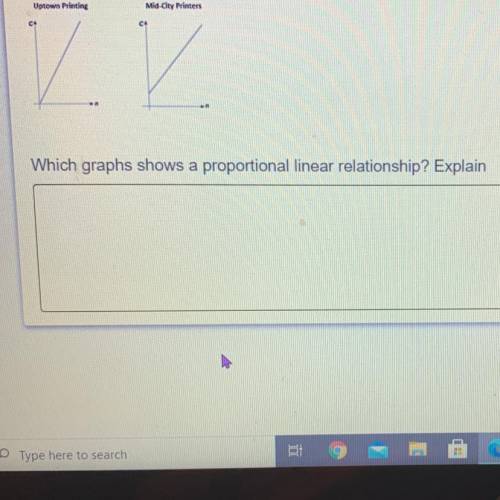
These graphs show the cost, C, for ordering n homecoming dance invitations from two different companies.
Uptown Printing
Mid-City Printers
C.
Z Z
Which graphs shows a proportional linear relationship? Explain

Answers: 2


Other questions on the subject: Mathematics
Mathematics, 21.06.2019 17:30, kruzyoungblood8
When a rectangle is dilated, how do the perimeter and area of the rectangle change?
Answers: 2
Mathematics, 21.06.2019 18:00, queenofspades
Saline iv fluid bags cost $64.20 for 24, 1000 ml bags from one supplier. a new supplier sells 500 ml bags for $2 each. the hospital uses about 10,000, 1000 ml bags each month. nurses report that about half of the bags are more than half full when they are discarded. if you are going to use only one supplier, which size bag provides the best deal, and how much will you save each month? compare the cost of the new supplier to the current one.
Answers: 1
Do you know the correct answer?
These graphs show the cost, C, for ordering n homecoming dance invitations from two different compan...
Questions in other subjects:


Mathematics, 26.02.2020 23:20
Mathematics, 26.02.2020 23:20


History, 26.02.2020 23:20


