

Mathematics, 17.11.2020 20:00, Dericktopsom
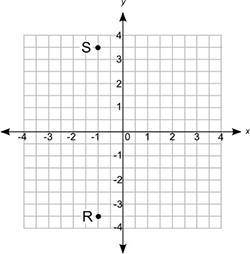
Points R and S on the coordinate grid below show the positions of two midfield players of a soccer team:
Which statement best describes the relationship between the positions of the two midfield players? (1 point)
a
S is R reflected across the y-axis; only the signs of the x-coordinates of R and S are different.
b
S is R reflected across the y-axis; only the signs of the y-coordinates of R and S are different.
c
S is R reflected across the x-axis; only the signs of the x-coordinates of R and S are different.
d
S is R reflected across the x-axis; only the signs of the y-coordinates of R and S are different.

Answers: 2


Other questions on the subject: Mathematics
Mathematics, 22.06.2019 00:30, brittsterrr
When you flip a biased coin the probability of getting a tail is 0.6. how many times would you expect to get tails if you flip the coin 320 times?
Answers: 1
Mathematics, 22.06.2019 01:50, salsa456
Anew movie is released each year for 14 years to go along with a popular book series. each movie is 2 minutes longer than the last to go along with a plot twist. the first movie is 70 minutes long. use an arithmetic series formula to determine the total length of all 14 movies
Answers: 3
Mathematics, 22.06.2019 02:00, mathhelppls14
1. the manager of collins import autos believes the number of cars sold in a day (q) depends on two factors: (1) the number of hours the dealership is open (h) and (2) the number of salespersons working that day (s). after collecting data for two months (53 days), the manager estimates the following log-linear model: q 4 equation 1 a. explain, how to transform the log-linear model into linear form that can be estimated using multiple regression analysis. the computer output for the multiple regression analysis is shown below: q4 table b. how do you interpret coefficients b and c? if the dealership increases the number of salespersons by 20%, what will be the percentage increase in daily sales? c. test the overall model for statistical significance at the 5% significance level. d. what percent of the total variation in daily auto sales is explained by this equation? what could you suggest to increase this percentage? e. test the intercept for statistical significance at the 5% level of significance. if h and s both equal 0, are sales expected to be 0? explain why or why not? f. test the estimated coefficient b for statistical significance. if the dealership decreases its hours of operation by 10%, what is the expected impact on daily sales?
Answers: 2
Do you know the correct answer?
Points R and S on the coordinate grid below show the positions of two midfield players of a soccer t...
Questions in other subjects:


Social Studies, 29.11.2020 22:50

Arts, 29.11.2020 22:50
Mathematics, 29.11.2020 22:50
Mathematics, 29.11.2020 22:50

World Languages, 29.11.2020 22:50


