

Mathematics, 17.11.2020 16:50, sissygirl0807
Ricardo has just taken over his parents' restaurant. He knows after working there for many years that one of the major concerns among employees is competitive pay. Specifically, Ricardo's servers think that they are paid less than servers in similar restaurants.
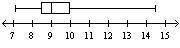
To help investigate this issue, Ricardo employs a company that specializes in gathering data about pay rates for similar positions across the state. The company provides Ricardo with the following box-and-whisker plot.
Ricardo's goal is to provide his servers with competitive pay compared to other restaurants in the state. He currently pays his servers hourly rates ranging from $8.50 to $11.50, depending on experience and seniority. His median server pay is $8.83. Based on what he sees in the plot above, which of the following is an appropriate conclusion for Ricardo?
A.
Ricardo's median is consistent with the state median. Ricardo should leave his servers' pay as it is.
B.
Most of Ricardo's servers are paid more than the state median. Ricardo should leave his servers' pay as it is.
C.
Ricardo's minimum, maximum, and median are all significantly less that those of the state. Ricardo should increase his servers' pay.
D.
Almost half of other servers across the state make more than the highest paid of Ricardo's servers. Ricardo should increase his servers' pay.

Answers: 3


Other questions on the subject: Mathematics
Mathematics, 21.06.2019 17:30, liquidmana42
When the solutions to each of the two equations below are graphed in the xy-coordinate plane, the graphs of the solutions intersect at two places. write the y-cordninates of the points of intersection in the boxes below in order from smallest to largest. y=2x y=x^2-3
Answers: 1
Do you know the correct answer?
Ricardo has just taken over his parents' restaurant. He knows after working there for many years tha...
Questions in other subjects:

Geography, 12.04.2020 00:13
Mathematics, 12.04.2020 00:13


Mathematics, 12.04.2020 00:14


