

Mathematics, 17.11.2020 01:00, katherinemoreno353
Answer to this:
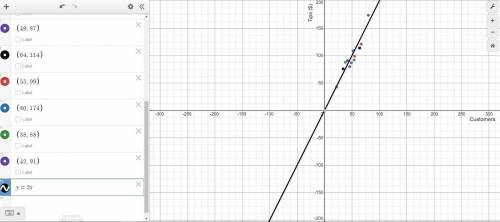
You and your business partner track the number of customers served and the amount of tips collected per day. The data you gathered is displayed in the chart below.
Servers’ Collected Tips
Customers 54 46 34 67 52 22 49 64 55 80 38 42
Tips ($) $92 $80 $76 $121 $109 $43 $87 $114 $99 $174 $88 $91
a) Create a scatter plot displaying the data in the table. Be sure to include a linear trend line.
b) Find the equation of the trend line (line of best fit). Show your work.
c) Predict the amount of tips that would be collected if 100 customers were served at the restaurant on a given day. Explain your reasoning.
d) Explain how to use the regression calculator to make a reasonable prediction given a data table.
ISSS:
Simply create a scatter plot then write in a line of best fit.
Step-by-step explanation:

Answers: 1


Other questions on the subject: Mathematics
Mathematics, 21.06.2019 19:30, makaylahunt
Aregular pentagon with a perimeter of 21 inches is dilated by a scale factor of 5/3 to create a new pentagon. what is the perimeter of the new pentagon?
Answers: 2
Mathematics, 21.06.2019 20:30, asdfjk6421
2/3(-6y+9x) expand each expression using the distributive property
Answers: 3
Do you know the correct answer?
Answer to this:
You and your business partner track the number of customers served and the amount o...
Questions in other subjects:


