Step-by-step explanation:
The data in the question are not properly presented.
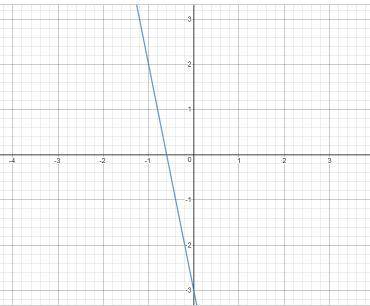
See attachment for graph
To determine the graph, first we need to calculate the slope (m)

Where x and y are corresponding values:
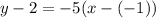
When x = -1; y = 2;
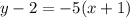
This implies 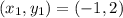
When x = 0; y = -3
This implies 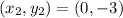
So:


The equation is then calculated using:
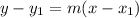
Where:
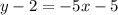
Make y the subject
Please note that the graph I attached may/may not be the right graph to your question.
However, if you follow the steps I used in answering this question, you'll get the right answer to your question.