

Mathematics, 15.11.2020 14:50, scottmichetti
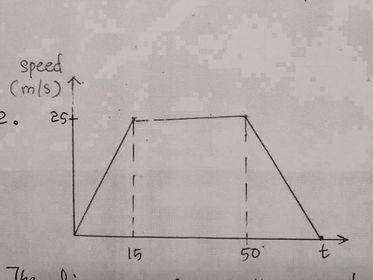
The diagram (picture) shows the speed-time graph of a body moving in a straight line.
(a) Calculate he acceleration of the body during the first 15 seconds.
(b) Calculate the distance moves by the body in the first 40 seconds of its motion.
(c) Given that the body decelerate at 1.25 m/s

Answers: 3


Other questions on the subject: Mathematics
Mathematics, 21.06.2019 13:00, joThompson
Determine whether the angles in each given pair are coterminal. 744°, -336°
Answers: 1
Mathematics, 21.06.2019 16:30, dimpleschris101
Marco is studying a type of mold that grows at a fast rate. he created the function f(x) = 345(1.30)x to model the number of mold spores per week. what does the 1.30 represent? how many mold spores are there after 4 weeks? round your answer to the nearest whole number. 1.30 represents the number of mold spores marco had at the beginning of the study; 985 mold spores 1.30 represents the number of mold spores grown in a given week; 448 mold spores 1.30 represents the 30% rate of weekly growth; 345 mold spores 1.30 represents the 30% rate of weekly growth; 985 mold spores
Answers: 1
Do you know the correct answer?
The diagram (picture) shows the speed-time graph of a body moving in a straight line.
(a) Calculate...
Questions in other subjects:
Mathematics, 08.02.2021 06:50


Physics, 08.02.2021 06:50

Chemistry, 08.02.2021 06:50

Health, 08.02.2021 06:50


