

Mathematics, 15.11.2020 04:30, caroline1390
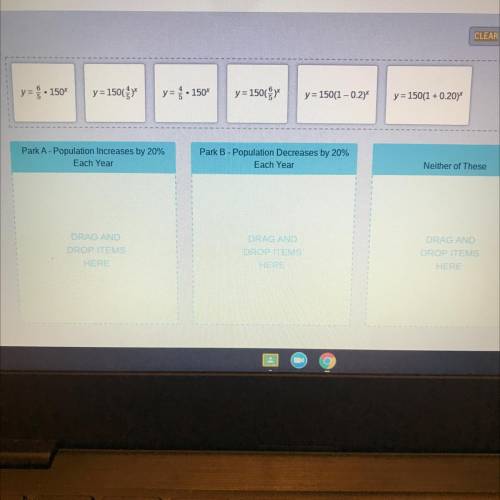
A scientist is observing the grizzly bear population in two state parks. The parks each
have 150 bears when he begins observing them. The population in Park A increases
by 20% each year. The population in Park B decreases by 20% each year.
In each equation, y represents the bear population with respect to a number of years, X.
Drag each equation to show whether it can be used to represent the bear population in
Park A, Park B, or neither of these.

Answers: 1


Other questions on the subject: Mathematics
Mathematics, 21.06.2019 17:20, ponylover9655
Read the situations in the table below. then drag a graph and equation to represent each situation. indicate whether each of the relationships is proportional or non-proportional. edit : i got the right answer its attached
Answers: 2
Mathematics, 21.06.2019 20:00, chantelljenkins2
True or false: the graph of y=f(bx) is a horizontal compression of the graph y=f(x) if b< 1
Answers: 2
Do you know the correct answer?
A scientist is observing the grizzly bear population in two state parks. The parks each
have 150 be...
Questions in other subjects:


Chemistry, 01.11.2019 19:31

History, 01.11.2019 19:31


Mathematics, 01.11.2019 19:31


