


The following line graph shows the attendance at an annual event from 1998

Mathematics, 13.11.2020 01:30, stevenabdullatif16
Se Home
ework
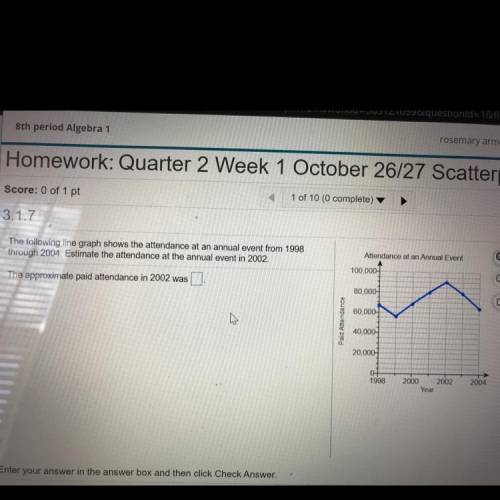
The following line graph shows the attendance at an annual event from 1998
through 2004. Estimate the attendance at the annual event in 2002,
The approximate paid attendance in 2002 was.
Attendance at an Annual Event
100,000
zes & Tests
Q
80,000
dy Plan
60.000
Paid Attendance
debook
40,000
20.000
apter Contents
0-
1998
ols for Success
2000
2002
Year
2004
ultimedia Librai
earson Tutor
ervices

Answers: 1
Other questions on the subject: Mathematics
Mathematics, 20.06.2019 18:04, nommies005
Prove the divisibility of the following numbers: ! i have no any is 1. 16^5 + 2^15 by 33 2. 15^7 + 5^13 by 30
Answers: 1
Do you know the correct answer?
Se Home
ework
The following line graph shows the attendance at an annual event from 1998
The following line graph shows the attendance at an annual event from 1998
Questions in other subjects:
Mathematics, 01.11.2019 11:31


English, 01.11.2019 11:31

History, 01.11.2019 11:31
Mathematics, 01.11.2019 11:31


