

Mathematics, 13.11.2020 01:00, wolfycatsz74
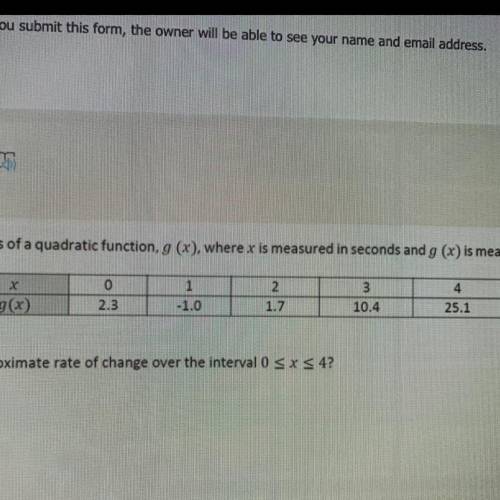
The tables below is a quadratic function, g (x), where x is measured in seconds and g (x) is measured in meters. What is the approximate rate of change over the interval
Answer choices
A. 22.8
B. 8.7
C. 6.3
D. 5.7

Answers: 2


Other questions on the subject: Mathematics
Mathematics, 21.06.2019 21:00, walkinginmypurpose
Use the following random list of 100 numbers and the same assignations as in the example (0-4 represent girls and 5-9 represent boys) to answer the questions below. 3199 9288 1023 1130 0809 1770 6231 7538 8927 4761 7258 7111 0209 0916 1450 9848 4654 7579 6150 3093 9608 0061 4014 9501 0382 3052 2385 9074 1664 6551 6577 1811 3454 5870 1277 5056 1063 5697 9141 4120 9181 1343 0168 3693 0463 4842 1704 3774 4908 4161 6404 9675 2518 3988 4268 6083 0636 9634 5295 5656 1918 3133 6831 8393 6363 2452 1531 1638 1317 2279 9395 0702 2091 5269 0422 0275 3373 1424 1958 0356 5163 0743 6658 6257 2772 0570 4522 2665 0890 3560 5549 2238 2172 9715 9741 4975 6617 9034 4441 8220 based on the results of the second simulation, what is the experimental probability that a group will include only boys? based on the results of the second simulation, what is the experimental probability that a group will not contain four boys?
Answers: 2
Mathematics, 22.06.2019 00:00, staz13wiggins
Why is x= 4 a solution to the proportion 14/x 56/1 6
Answers: 1
Mathematics, 22.06.2019 01:00, sawyerharper
The price for gasoline is represented by the equation y=3.69x, where y represents the total price for x gallons of gasoline. on a graph, the number of gallons is represented on the horizontal axis, and the total price is represented on the vertical axis. determine whether each statement describes the graph of the equation. select true or false for each statement
Answers: 2
Do you know the correct answer?
The tables below is a quadratic function, g (x), where x is measured in seconds and g (x) is measur...
Questions in other subjects:
Mathematics, 10.07.2019 11:50

Biology, 10.07.2019 11:50


Chemistry, 10.07.2019 11:50


