

Mathematics, 12.11.2020 17:40, bhadd2001
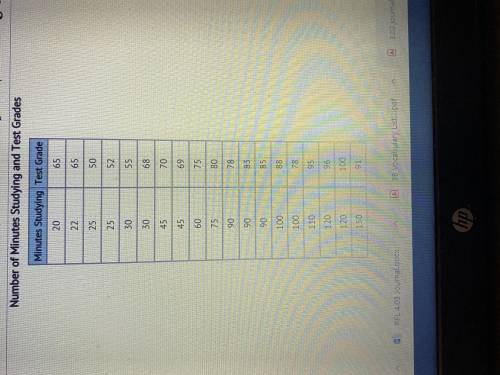
The chart shows number of minutes students spent studying for a test and their grade on the test. Draw a scatter plot of the data.
Which equation is closest to the line of best fit?
A) y=-1/3x-52
B) y= 1/3x + 52
C) y=-52x + 1/3
D) y=52x-1/3

Answers: 1


Other questions on the subject: Mathematics
Mathematics, 21.06.2019 22:00, jamarstand
What is the equation of the line that is parallel to the line with the equation y= -3/4x +1 and passes through the point (12,-12)
Answers: 1
Do you know the correct answer?
The chart shows number of minutes students spent studying for a test and their grade on the test. Dr...
Questions in other subjects:
Mathematics, 24.06.2021 14:40
Mathematics, 24.06.2021 14:40


Mathematics, 24.06.2021 14:50


