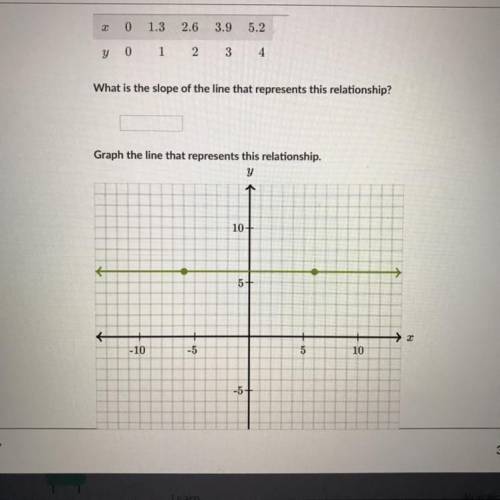
A proportional relationship is shown in the table below:
x:
0
1.3
2.6
3.9
5.2
y:
0
1
2
3
4.
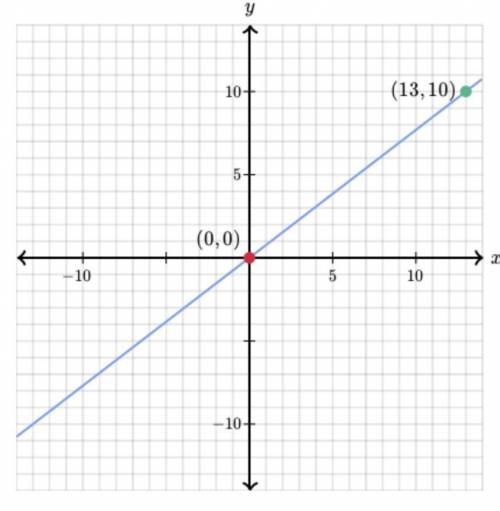
What is the slope of the line that represents this relationship?
Graph the line that represents this relationship.
Asap the total attendance for all of a baseball league in 2012 was about 7.5×10⁷ fans, while the attendance for the tornadoes in 2012 was about 1.5×10⁶ fans. about how many times more was the attendance for the entire baseball league than the attendance for just the tornadoes? 50 times more 10 times more 2 times more 5 times more