

Mathematics, 12.11.2020 01:00, shoafmckenzie1962
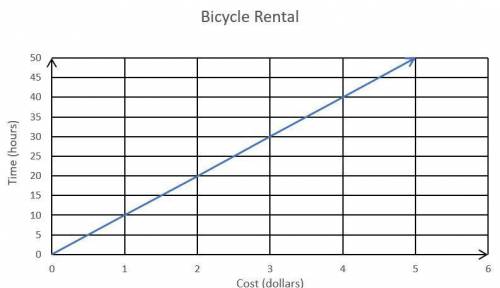
The table shows the relationship between y, the cost to rent a bicycle, and x, the
amount of time the bicycle is rented in hours.
Bicycle Rental Costs
Part 1: A student drew the following graph to represent this situation. Explain the error
in the graph. (Answer box on following page.)
Time, x}
(hours) }
1 } 10
2} 20
3} 30
(Question 1, part 1 answer.)
Part 2. Draw a correct graph to best represent the relationship between x and y shown in the table.
(Part 2 answer)
Part 3. Write a linear equation slope-intersect form to represent the data shown in this table
Part 3 answer...


Answers: 3


Other questions on the subject: Mathematics
Mathematics, 21.06.2019 17:30, sarinawhitaker
25 ! the line of best fit is h = 5a + 86. predict the height at age 16. show your work.
Answers: 1
Mathematics, 21.06.2019 20:30, phamleson8697
Will give let f(x)=2x and g(x)=[tex]2^{x}[/tex] graph the functions on the same coordinate plane. what are the solutions to the equation f(x)=g(x) ? enter your answers in the boxes x=[? ] or x=[? ]
Answers: 1
Do you know the correct answer?
The table shows the relationship between y, the cost to rent a bicycle, and x, the
amount of time t...
Questions in other subjects:
Mathematics, 24.08.2020 01:01


English, 24.08.2020 01:01


