

Mathematics, 11.11.2020 21:00, bazsinghnagoke
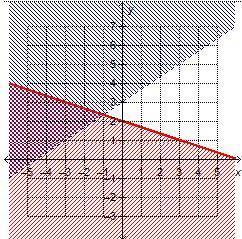
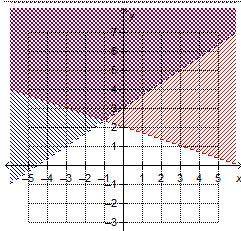
PLEASE HELP ILL GIVE BRAINLEST TO BEST ANSWER.Which graph shows the solution to the system of linear inequalities?
y >2/3x + 3
y ≤ -1/3x + 2


Answers: 3


Other questions on the subject: Mathematics
Mathematics, 21.06.2019 17:30, emmilicious
Me with this one question, and i'll upvote the brainliest answer
Answers: 2
Mathematics, 21.06.2019 17:30, CarlosCooke2
You can find the constant of proportionality by finding the ratio of
Answers: 1
Mathematics, 21.06.2019 20:00, ZaneKun
Need ! the total ticket sales for a high school basketball game were $2,260. the ticket price for students were $2.25 less than the adult ticket price. the number of adult tickets sold was 230, and the number of student tickets sold was 180. what was the price of an adult ticket?
Answers: 1
Do you know the correct answer?
PLEASE HELP ILL GIVE BRAINLEST TO BEST ANSWER.Which graph shows the solution to the system of linear...
Questions in other subjects:


Mathematics, 25.07.2020 06:01


