Mathematics, 03.11.2019 07:31, hsbhxsb
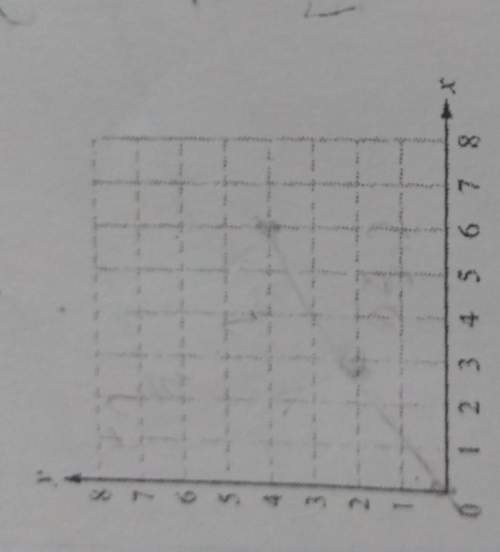
John drew the line of best fit on the scatter plot shown. a graph is shown with scale along x axis from 0 to 10 at increments of 1 and scale along y axis from 0 to 15 at increments of 1 and scale along y axis from 0 to 15 at increments of 1. the ordered pairs 0, 3 and 1, 2 and 2, 4 and 3, 6 and 4, 6 and 5, 8 and 6, 10 and 7, 11 and 8, 12 and 9, 12 and 10, 14 are shown on the graph. a straight line joins the ordered pairs 0, 2 and 10, 14. what is the equation of this line of best fit in slope-intercept form? y = 2x + 6 over 5 y = 5 over 6x + 2 y = 2x + 5 over 6 y = 6 over 5x + 2

Answers: 2
Other questions on the subject: Mathematics

Mathematics, 21.06.2019 16:00, michellealvarez985
Quadrilateral wxyz is on a coordinate plane. segment yz is on the line x+y=7 and segment xw is on the line x+y=3. which statement proves how segments yz and xw are related
Answers: 1


Mathematics, 22.06.2019 01:40, amendes11
Areflection of shape i across the y-axis, followed by a , and then a translation left 6 units and down 4 units confirms congruence between shape i and shape ii. alternatively, a of shape ii about the origin, followed by a reflection across the y-axis, and then a translation right 4 units and up 6 units confirms congruence between shape ii and shape i.
Answers: 3

Mathematics, 22.06.2019 02:00, amberskids2
Consider the linear function that is represented by the equation y= 4x+5
Answers: 1
Do you know the correct answer?
John drew the line of best fit on the scatter plot shown. a graph is shown with scale along x axis f...
Questions in other subjects:


Mathematics, 25.08.2019 14:00


Chemistry, 25.08.2019 14:00


Social Studies, 25.08.2019 14:00


Mathematics, 25.08.2019 14:00


Health, 25.08.2019 14:00


