

Mathematics, 10.11.2020 23:20, Jana1517
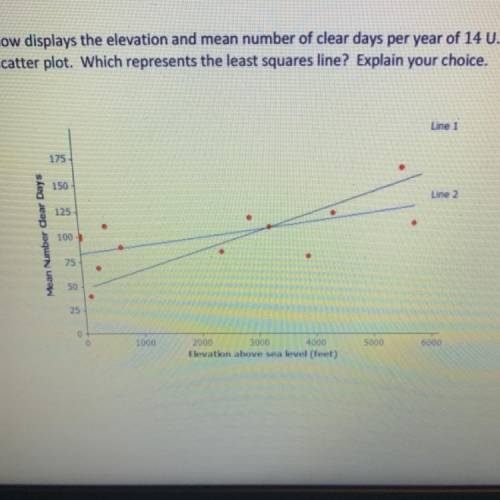
The scatter plot below displays the elevation and mean number of clear days per year of 14 U. S. cities. Two lines
are shown on the scatter plot. Which represents the least squares line? Explain your choice.
Line 1
175
150
Line 2
125
Mean Number dear Days
100)
75
50
25
0
1000
2000
3000
Elevation above sea level (feet)
4000
5000
6000

Answers: 1


Other questions on the subject: Mathematics
Mathematics, 21.06.2019 20:00, samaragreen34
Ke’ajah has a coupon for 1/3 off the regular price, t, of a tent. which expression represents the price of the tent using the coupon? select the two correct expressions. a. 1/3t b. 2/3t c. t - 1/3 d. t - 2/3 e. t - 1/3t f. t - 2/3t
Answers: 1
Mathematics, 21.06.2019 20:30, kingdesto3481
The function v(r)=4/3pir^3 can be used to find the volume of air inside a basketball given its radius. what does v(r) represent
Answers: 1
Do you know the correct answer?
The scatter plot below displays the elevation and mean number of clear days per year of 14 U. S. cit...
Questions in other subjects:

Health, 14.01.2021 01:10


History, 14.01.2021 01:10
Mathematics, 14.01.2021 01:10

History, 14.01.2021 01:10

Mathematics, 14.01.2021 01:10


