

Mathematics, 10.11.2020 18:30, dustinralph9768
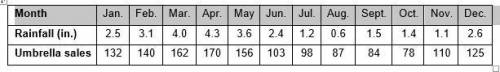
3. Patty’s Parasols recorded the monthly rainfall and their umbrella sales for an entire year. The following table shows the inches of rainfall and the number of umbrellas the store sold each month. The relationship between the inches of rainfall and umbrella sales can be modeled using a linear function.
TABLE IN IMAGE
(a) Using technology, determine the correlation coefficient for the data to the nearest hundredth. Explain the steps you used.
(b) What does the correlation coefficient for the data indicate about the direction and strength of the linear association between the monthly rainfall and the number of umbrellas sold?

Answers: 3


Other questions on the subject: Mathematics
Mathematics, 21.06.2019 16:10, cthompson1107
Which expression gives the area of the triangle shown below
Answers: 1
Do you know the correct answer?
3. Patty’s Parasols recorded the monthly rainfall and their umbrella sales for an entire year. The f...
Questions in other subjects:

History, 04.07.2019 06:00
Mathematics, 04.07.2019 06:00
Mathematics, 04.07.2019 06:00

English, 04.07.2019 06:00
Mathematics, 04.07.2019 06:00
Mathematics, 04.07.2019 06:00


