

Mathematics, 08.11.2020 04:00, and7393
Textbook. Use Excel and the GSS 2018 dataset to conduct a Multiple Linear Regression analysis of some of the factors associated with individual income levels. Select any two explanatory independent variables and two control independent variables from the GSS 2018 dataset that you believe would be associated with the dependent variable RINCOM16. Note: If you select a nominal variable as an independent variable, select one with only two valid response categories. The four independent variables you select must meet the requirement for Model Fit - have an F-statistic (reported in the ANOVA Table) that is statistically significant at the 5% level when you run your regression in Excel.
Step 1:
From the GSS Codebook, copy and paste the question associated with each of the variables as well as their response categories and numeric codes. For interval-ratio variables or ordinal variables with many categories, just the range of responses and numeric codes would suffice.
Describe one hypothesis for the expected direction (positive or negative) and strength (weak, moderate or strong) of the relationship between each of the two explanatory independent variables you selected and the dependent variable-RINCOM16 in the US population in 2018. For the purpose of this exercise, your hypotheses need not be be based on theoretical knowledge, just your own knowledge about the possible relationship between each independent variable and the dependent variable. Important: Your hypothesized direction of the relationship must take into account the numeric coding of the response categories for both variables (refer to the GSS Codebook to do so).
Step 2:
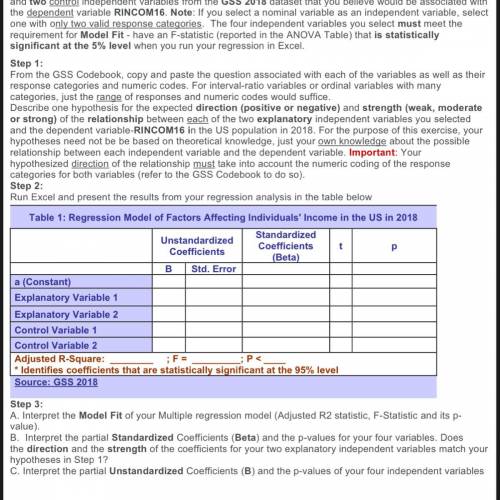
Run Excel and present the results from your regression analysis in the table attached. Step 3:
A. Interpret the Model Fit of your Multiple regression model (Adjusted R2 statistic, F-Statistic and its p-value).
B. Interpret the partial Standardized Coefficients (Beta) and the p-values for your four variables. Does the direction and the strength of the coefficients for your two explanatory independent variables match your hypotheses in Step 1?
C. Interpret the partial Unstandardized Coefficients (B) and the p-values of your four independent variables
Step 4:
For your Multiple Linear Regression model, write down the Least Squares Regression equation reporting your relevant regression coefficients (replace a & b1 through b4 in the equation below with the regression coefficients from Table 1 above:
Y-Predicted = a + b1X1 + b2X2 + b3X3 + b4X4
Using the guidelines provided in the chapter, calculate the predicted score of RINCOM16 for an individual with one hypothetical set of scores or responses for the four independent variables you selected. What would be that individual's predicted income category in $s?

Answers: 2


Other questions on the subject: Mathematics
Mathematics, 21.06.2019 14:30, LuxTheGirl2543
Your friend swims on the school team. in his first four races, his times are 24.7, 23.5, 25.6, and 27.2 seconds. which time listed for his next race would make the range larger?
Answers: 1
Mathematics, 21.06.2019 16:00, lidsrays
Select the correct answer. joshua likes to read. he read 6 books when he was 6 years old. every year he doubled the number of books he read the previous year. how many total books did he read between the ages of 6 and 10? a. 60 b. 90 c.186 d.187
Answers: 1
Mathematics, 21.06.2019 21:00, lunnar2003
Graph the system of inequalities presented here on your own paper, then use your graph to answer the following questions: y < 4x − 8 y is greater than or equal to negative 5 over 2 times x plus 5 part a: describe the graph of the system, including shading and the types of lines graphed. provide a description of the solution area. (6 points) part b: is the point (5, −8) included in the solution area for the system? justify your answer mathematically. (4 points)
Answers: 3
Do you know the correct answer?
Textbook. Use Excel and the GSS 2018 dataset to conduct a Multiple Linear Regression analysis of som...
Questions in other subjects:
Mathematics, 09.06.2021 17:10
Mathematics, 09.06.2021 17:10


Mathematics, 09.06.2021 17:10

English, 09.06.2021 17:10


