


The bar graph shows the average annual spending per
person on selected items in 2010.
The com...

Mathematics, 08.11.2020 03:10, kitttimothy55
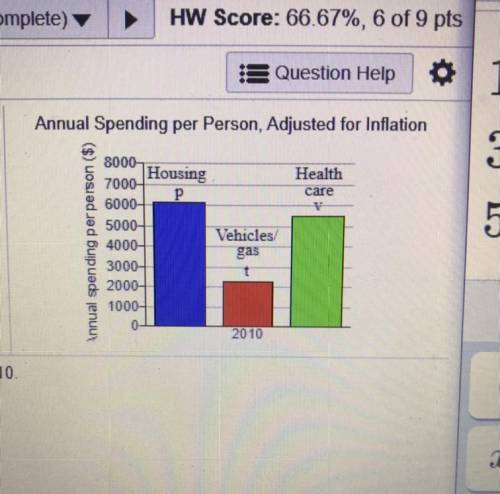
The bar graph shows the average annual spending per
person on selected items in 2010.
The combined spending on housing, vehicles/gas, and
health care was $13,883. The difference between
spending on housing and spending on vehicles/ga
s was
$3846. The difference between spending on housing
and spending on health care was $592.
Find the average per-person spending on housing in 2010

Answers: 3
Other questions on the subject: Mathematics
Mathematics, 21.06.2019 15:30, bankzdown
Kevin is an insurance salesman. when he sells a policy, he makes 20 percent of the policy premium (p) up front; then each year the policy is active, he receives 15 percent of the original premium. which equation could be used to figure his total commission on a policy that has been active for five years? c=0.80p c=0.20p + 0.15p c=0.35p + 4(0.15) c=0.95p
Answers: 1
Mathematics, 21.06.2019 21:30, kassandramarie16
Noel is hoping to make a profit (in $) on the school play and has determined the function describing the profit to be f(t) = 8t – 2654, where t is the number of tickets sold. what does the number 8 tell you?
Answers: 1
Do you know the correct answer?
Questions in other subjects:
Mathematics, 31.01.2020 22:58


Mathematics, 31.01.2020 22:58


History, 31.01.2020 22:58


