

Mathematics, 07.11.2020 07:30, coliver15
Step 2: Evaluating trends of data
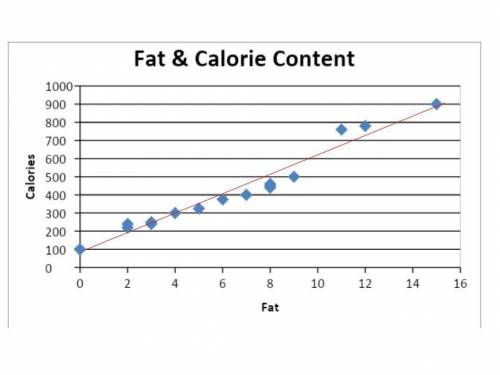
Because you want to prepare and serve the healthiest food possible, you monitor the fat and calorie content of items on your menu. Some of the menu items are included in the graph below.
a) Your business partner describes this as a high positive correlation. Is your partner correct? Why or why not? (2 points)
b) Using the drawing tools, draw a trend line (line of best fit) on the graph above. (2 points)
c) Judge the closeness of your trend line to the data points. Do you notice a relationship between the data points? (2 points)
d) Is the trend line linear? If so, write a linear equation that represents the trend line. Show your work. (3 points)
ill give you brainliest if u get this answer correct. If u put in a random answer = reported

Answers: 2


Other questions on the subject: Mathematics
Mathematics, 21.06.2019 16:00, maddy3lizabeth
Find the amount in a continuously compounded account for the given condition. principal: $1000, annual interest rate: 4.8%, time: 2 yr
Answers: 3
Do you know the correct answer?
Step 2: Evaluating trends of data
Because you want to prepare and serve the healthiest food possibl...
Questions in other subjects:

History, 06.10.2020 14:01

Physics, 06.10.2020 14:01
Mathematics, 06.10.2020 14:01


Biology, 06.10.2020 14:01


