

Mathematics, 07.11.2020 04:50, shaeelynn3734
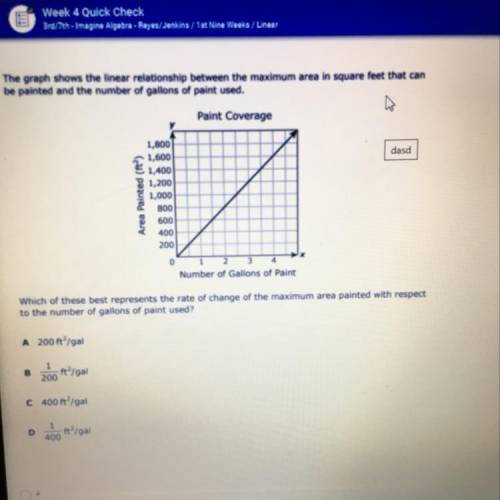
The graph shows the linear relationship between the maximum area in square feet that can
be painted and the number of gallons of paint used.
Paint Coverage
dasd
1,000
1,600
1,400
21,200
1,000
800
600
400
200
0
Number of Gallons of Paint
Which of these best represents the rate of change of the maximum area painted with respect
to the number of gallons of paint used?
A 200ft/gal
200 m2 /981
C 400 ft/gal
D.00 n 1981

Answers: 1


Other questions on the subject: Mathematics
Mathematics, 21.06.2019 19:30, dolltan
The table below represents the displacement of a fish from its reef as a function of time: time (hours) x displacement from reef (feet) y 0 4 1 64 2 124 3 184 4 244 part a: what is the y-intercept of the function, and what does this tell you about the fish? (4 points) part b: calculate the average rate of change of the function represented by the table between x = 1 to x = 3 hours, and tell what the average rate represents. (4 points) part c: what would be the domain of the function if the fish continued to swim at this rate until it traveled 724 feet from the reef? (2 points)
Answers: 2
Do you know the correct answer?
The graph shows the linear relationship between the maximum area in square feet that can
be painted...
Questions in other subjects:

History, 02.04.2021 14:10

Social Studies, 02.04.2021 14:10
Social Studies, 02.04.2021 14:10

Biology, 02.04.2021 14:10
Social Studies, 02.04.2021 14:10

Mathematics, 02.04.2021 14:10
Mathematics, 02.04.2021 14:10
History, 02.04.2021 14:10


