


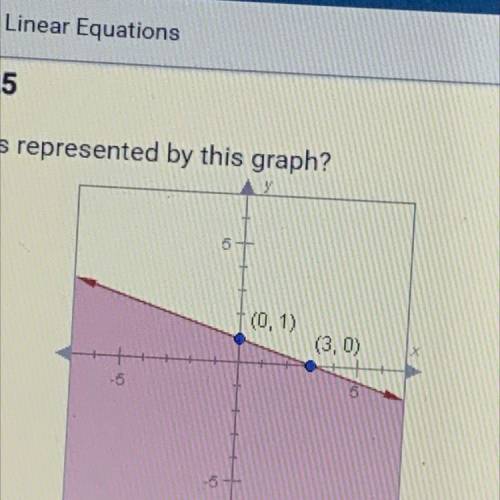
Which inequality is represented by this graph?
5+
(0,1)
(3,0)
A. ys-3x+1
B....

Mathematics, 07.11.2020 01:10, kaileyy06
Which inequality is represented by this graph?
5+
(0,1)
(3,0)
A. ys-3x+1
B. y>-*x+1
C. 72-3x+1
D. y< -1x+1

Answers: 2
Other questions on the subject: Mathematics
Mathematics, 21.06.2019 18:00, SunsetPrincess
Solve this equation using substitution. {4x + y = −2} {4x + 6y = 44}
Answers: 1
Mathematics, 21.06.2019 19:20, harmonytaylor13
Is the product of two rational numbers irrational or rational? first, make a hypothesis by multiplying two rational numbers. then, use variables such as x=a/b and y=c/d and the closure property of integers to prove your hypothesis.
Answers: 1
Mathematics, 21.06.2019 22:30, Edwardwall
What three-dimensional solid have 6 rectangular faces, 2 equal bases that are not rectangles and 18 edges
Answers: 3
Mathematics, 22.06.2019 01:40, Anshuman2002
(co 3) the soup produced by a company has a salt level that is normally distributed with a mean of 5.4 grams and a standard deviation of 0.3 grams. the company takes readings of every 10th bar off the production line. the reading points are 5.8, 5.9, 4.9, 6.5, 5.0, 4.9, 6.2, 5.1, 5.7, 6.1. is the process in control or out of control and why? it is out of control as two of these data points are more than 2 standard deviations from the mean it is in control as the data points more than 2 standard deviations from the mean are far apart it is out of control as one of these data points is more than 3 standard deviations from the mean it is in control as the values jump above and below the mean
Answers: 2
Do you know the correct answer?
Questions in other subjects:
Mathematics, 14.04.2020 04:56


English, 14.04.2020 04:56


