

Mathematics, 06.11.2020 18:30, robbyd47
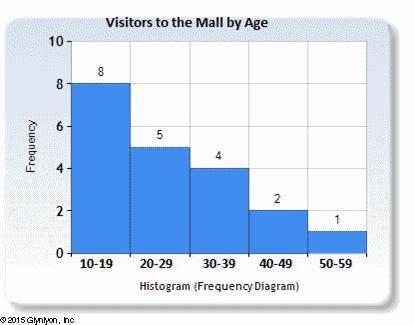
This histogram represents a sampling of recent visitors to the mall on a Friday night, grouped by their ages. If you knew the exact values of the data points for this data set, which measure of center (the mean or median) would most likely provide a more accurate picture of the data set? Explain your reasoning.

Answers: 2


Other questions on the subject: Mathematics
Mathematics, 21.06.2019 21:50, neirabrandon516
Question 14 (1 point) larry deposits $15 a week into a savings account. his balance in his savings account grows by a constant percent rate.
Answers: 3
Mathematics, 21.06.2019 22:30, izabelllreyes
Gabrielle's age is two times mikhail's age. the sum of their ages is 84. what is mikhail's age?
Answers: 2
Mathematics, 21.06.2019 22:30, Afranker8778
Write the equation of a line that is perpendicular to the given line and that passes through the given point. –3x – 6y = 17; (6, 3) y = x – 9 y = 2x – 9 y = –2x – 9 y = x + 0 3. is the relationship shown by the data linear? if so, model the data with an equation. x y 1 5 5 10 9 15 13 20 the relationship is linear; y – 5 = (x – 1). the relationship is not linear. the relationship is linear; y – 5 = (x – 1). the relationship is linear; y – 1 = (x – 5). write an equation in point-slope form for the line through the given point with the given slope. (–10, –1); m = y + 10 = (x + 1) y – 1 = (x – 10) y – 1 = (x + 10) y + 1 = (x + 10) 5. write an equation for each translation of . 6.5 units up y + 6.5 = | x | y = | 6.5 x | y = | x | + 6.5 y = | x | – 6.5 6. write an equation for each translation of . 5.5 units right y = | x | + 5.5 y = | x – 5.5 | y = | x | – 5.5 y = | x + 5.5 | 7. which equation translates y = | x | by 8 units to the left? y = | x | – 8 y = | x | + 8 y = | x – 8| y = | x + 8|
Answers: 1
Do you know the correct answer?
This histogram represents a sampling of recent visitors to the mall on a Friday night, grouped by th...
Questions in other subjects:


Mathematics, 17.09.2021 23:40


