

Mathematics, 06.11.2020 05:50, megamorph
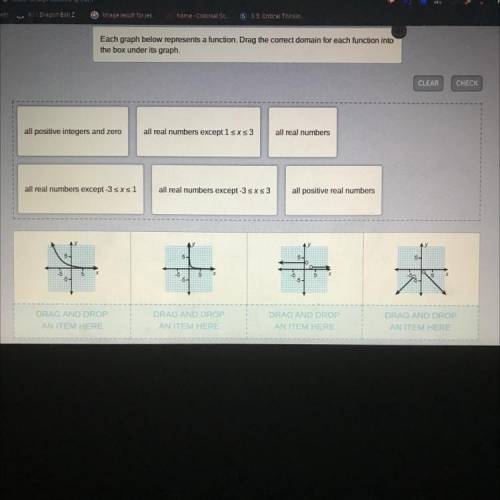
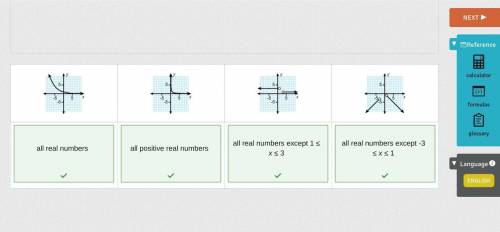
Each graph below represents a function. Drag the correct domain for each function into
the box under its graph.
CLEAR
CHECK
CHECK
all positive integers and zero
all real numbers except 1 sxs3
all real numbers
all real numbers except -3 sxs1
all real numbers except -3 sxs 3
all positive real numbers
+

Answers: 2


Other questions on the subject: Mathematics
Mathematics, 21.06.2019 19:30, tgentryb60
Now max recorded the heights of 500 male humans. he found that the heights were normally distributed around a mean of 177 centimeters. which statements about max’s data must be true? a) the median of max’s data is 250 b) more than half of the data points max recorded were 177 centimeters. c) a data point chosen at random is as likely to be above the mean as it is to be below the mean. d) every height within three standard deviations of the mean is equally likely to be chosen if a data point is selected at random.
Answers: 1
Mathematics, 21.06.2019 20:00, Chen5968
The distribution of the amount of money spent by students for textbooks in a semester is approximately normal in shape with a mean of $235 and a standard deviation of $20. according to the standard deviation rule, how much did almost all (99.7%) of the students spend on textbooks in a semester?
Answers: 2
Do you know the correct answer?
Each graph below represents a function. Drag the correct domain for each function into
the box unde...
Questions in other subjects:


Physics, 25.06.2019 19:40

Computers and Technology, 25.06.2019 19:40


