

Mathematics, 05.11.2020 22:10, kate9627
Evaluating a compound inequality using a graph
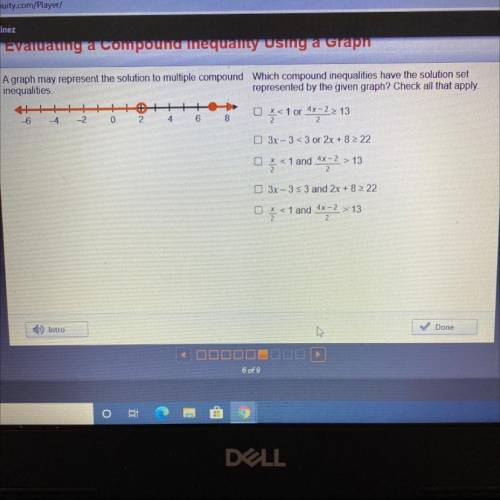
A graph may represent the solution to multiple compound Which compound inequalities have the solution set
inequalities
represented by the given graph? Check all that apply.
OX
4 6
6
8
21 or 4X-221
3x-3<3 or 2x + 8 222
<<1 and 4x=2 > 13
3x-35 3 and 2x + 8 2 22
Ž<1 and 4x=2 >13
Done
Intro

Answers: 3


Other questions on the subject: Mathematics
Mathematics, 21.06.2019 20:20, rleiphart1
Which of the following values are in the range of the function graphed below? check all that apply ! - will give the answer "brainliest! "
Answers: 1
Mathematics, 21.06.2019 20:30, daeshawnc14
What’s -11-33k and factor each expression completely
Answers: 2
Mathematics, 21.06.2019 20:50, kassandramarie16
Amanda went into the grocery business starting with five stores. after one year, she opened two more stores. after two years, she opened two more stores than the previous year. if amanda expands her grocery business following the same pattern, which of the following graphs represents the number of stores she will own over time?
Answers: 3
Do you know the correct answer?
Evaluating a compound inequality using a graph
A graph may represent the solution to multiple compo...
Questions in other subjects:


Spanish, 23.10.2020 14:00

Mathematics, 23.10.2020 14:00
Mathematics, 23.10.2020 14:00


