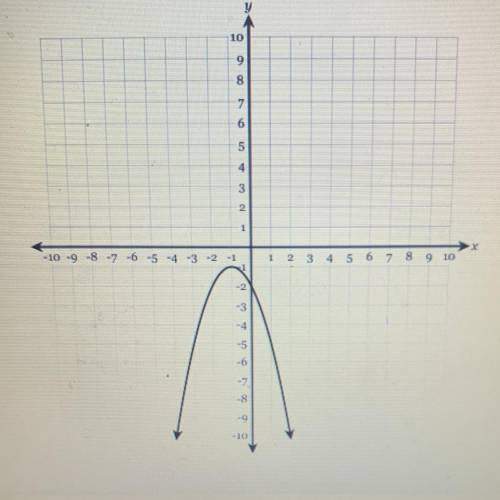
An x-intercept is a point where a parabola crosses the x-axis and is also known as a zero, root, or solution. Some quadratic functions cross the x-axis twice while others only cross the x-axis once, but this tutorial focuses on quadratic functions that never crosses the x-axis.
The best way to find out whether or not the parabola created by a quadratic formula crosses the x-axis is by graphing the quadratic function, but this is not always possible, so one might have to apply the quadratic formula to solve for x and find a real number where the resulting graph would cross that axis.
The quadratic function is a master class in applying the order of operations, and although the multistep process may seem tedious, it is the most consistent method of finding the x-intercepts. The easiest way to interpret quadratic functions is to break it down and simplify it into its parent function. This way, one can easily determine the values needed for the quadratic formula method of calculating x-intercepts. Remember that the quadratic formula states:
x = [-b +- √(b2 - 4ac)] / 2a
This can be read as x equals negative b plus or minus the square root of b squared minus four times ac over two a. The quadratic parent function, on the other hand, reads:
y = ax2 + bx + c
This formula can then be used in an example equation where we want to discover the x-intercept. Take, for instance, the quadratic function y = 2x2 + 40x + 202, and try to apply the quadratic parent function to solve for the x-intercepts. In order to properly solve this equation and simplify it down using the quadratic formula, you must first determine the values of a, b, and c in the formula you’re observing. Comparing it to the quadratic parent function, we can see that a is equal to 2, b is equal to 40, and c is equal to 202.
Next, we’ll need to plug this into the quadratic formula in order to simplify the equation and solve for x. These numbers in the quadratic formula would look something like this:
x = [-40 +- √(402 - 4(2)(202))] / 2(40) or x = (-40 +- √-16) / 80
In order to simplify this, we’ll need to realize a little something about mathematics and algebra first. In order to simplify the above equation, one would have to be able to solve for the square root of -16, which is an imaginary number that does not exist within the world of Algebra. Since the square root of -16 is not a real number and all x-intercepts are by definition real numbers, we can determine that this particular function does not have a real x-intercept.
To check this, plug it into a graphing calculator and witness how the parabola curves upwards and intersects with the y-axis, but does not intercept with the x-axis as it exists above the axis entirely.
The answer to the question “what are the x-intercepts of y = 2x2 + 40x + 202?” can either be phrased as “no real solutions” or “no x-intercepts,” because in the case of Algebra, both are true statements.