

Mathematics, 05.11.2020 18:50, Naysa150724
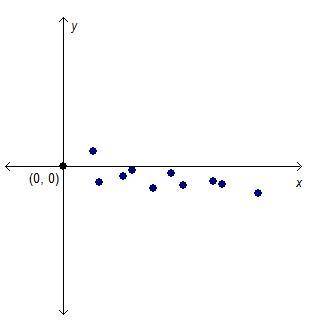
Consider the plot created from the residuals of a line of best fit for a set of data.
Does the residual plot show that the line of best fit is appropriate for the data?
A.) Yes, the points have no pattern.
B.) Yes, the points are evenly distributed about the x-axis.
C.) No, the points are in a linear pattern.
D.) No, the points are in a curved pattern.

Answers: 2


Other questions on the subject: Mathematics
Mathematics, 21.06.2019 19:00, gharrell03
Satchi found a used bookstore that sells pre-owned dvds and cds. dvds cost $9 each, and cds cost $7 each. satchi can spend no more than $45.
Answers: 1
Do you know the correct answer?
Consider the plot created from the residuals of a line of best fit for a set of data.
Does the resi...
Questions in other subjects:

English, 19.06.2020 03:57


Mathematics, 19.06.2020 03:57
Mathematics, 19.06.2020 03:57


