

Mathematics, 04.11.2020 22:40, mireyagonzaless6395
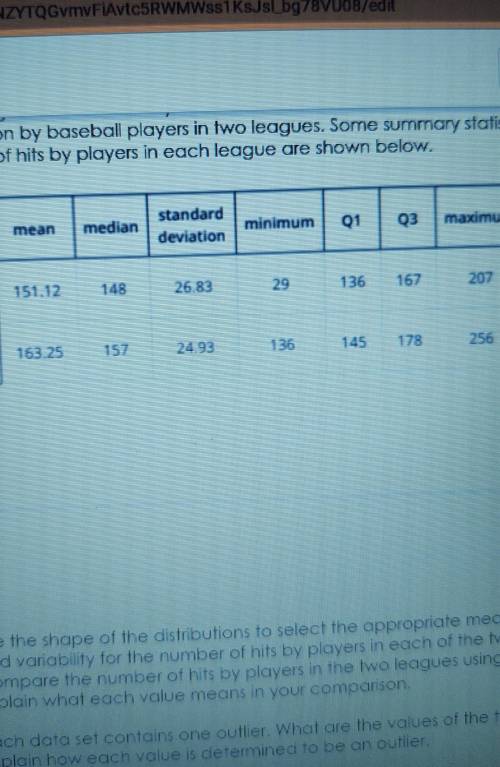
The histograms and summary statistics summarize the data for the number of hits in the season by baseball players in two leads. some summaries statistics for the number of hits by players in each league are shown below.
use the shape of the distributions to select the appropriate measures of center and variability for the number of hits by players in each of the two leagues. compare the number of hits by players in the two leagues using these measures explain what each value means in your comparison
(league A is the top row and B is the bottom row, my apologies they wouldn't fit)

Answers: 2


Other questions on the subject: Mathematics
Mathematics, 21.06.2019 22:30, Kemosdasavage
Need same math paper but the back now i hope your able to read it cleary i need with hw
Answers: 1
Mathematics, 22.06.2019 01:10, 3peak101
Awavelength of 610 nm was found to be the most intense wavelength emitted by copper. answer the following questions about this wavelength of light. a) what is this wavelength in cm? b) what is the frequency that corresponds to this wavelength? c) what is the energy of light of this wavelength? d) what is the wavenumber corresponding to this wavelength?
Answers: 2
Do you know the correct answer?
The histograms and summary statistics summarize the data for the number of hits in the season by bas...
Questions in other subjects:


