

Mathematics, 04.11.2020 06:40, brysong
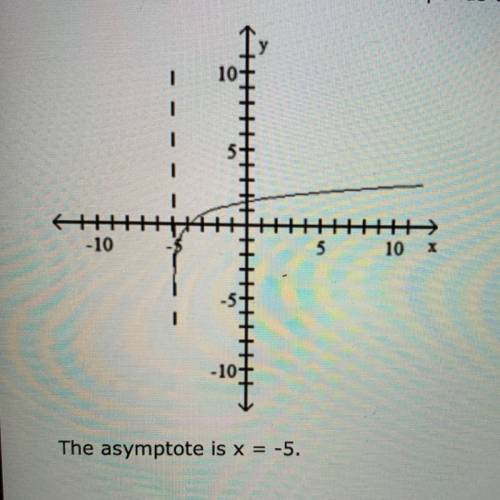
Determine the function which corresponds to the given graph. (5 points) The asymptote is x = -5.

Answers: 3


Other questions on the subject: Mathematics
Mathematics, 21.06.2019 22:00, zurfluhe
Manuela claims that and are congruent. which statement best describes her claim? she is incorrect because the segments do not have the same orientation. she is incorrect because the segments do not have the same length. she is correct because the segments have the same length. she is correct because the segments have the same orientation.
Answers: 1
Mathematics, 21.06.2019 22:00, prishnasharma34
The two box p digram the two box plots show the data of the pitches thrown by two pitchers throughout the season. which statement is correct? check all that apply. pitcher 1 has a symmetric data set. pitcher 1 does not have a symmetric data set. pitcher 2 has a symmetric data set. pitcher 2 does not have a symmetric data set. pitcher 2 has the greater variation. ots represent the total number of touchdowns two quarterbacks threw in 10 seasons of play
Answers: 1
Mathematics, 21.06.2019 22:20, dontworry48
Which graph represents the given linear function 4x+2y=3
Answers: 1
Do you know the correct answer?
Determine the function which corresponds to the given graph. (5 points)
The asymptote is x = -5.
Questions in other subjects:


Mathematics, 23.09.2019 19:50

History, 23.09.2019 19:50


