

Mathematics, 31.10.2020 02:00, maru91
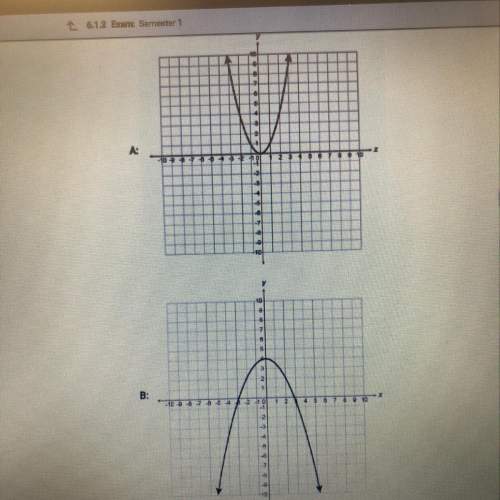
The graph below shows a company's profit f(x), in dollars, depending on the price of pencils x, in dollars, sold by the company:
Graph of quadratic function f of x having x intercepts at ordered pairs negative 0, 0 and 10, 0. The vertex is at 5, 160.
Part A: What do the x-intercepts and maximum value of the graph represent? What are the intervals where the function is increasing and decreasing, and what do they represent about the sale and profit? (4 points)
Part B: What is an approximate average rate of change of the graph from x = 2 to x = 5, and what does this rate represent? (3 points)
Part C: Describe the constraints of the domain. (3 points)

Answers: 3


Other questions on the subject: Mathematics
Mathematics, 21.06.2019 13:30, Packergood
34 cup. a serving of vegetable soup is 23 cup. the restaurant sold 20 servings of chicken noodle soup and 18 servings of vegetable soup. how many more cups of chicken noodle soup did they sell than cups of vegetable soup?
Answers: 2
Mathematics, 21.06.2019 16:30, danielmurillo28
If c(x) = 4x – 2 and d(x) = x2 + 5x, what is (cxd)(x)
Answers: 2
Mathematics, 21.06.2019 19:30, Jenan25
Consider this equation. |y + 6| = 2 what can be concluded of the equation? check all that apply. there will be one solution. there will be two solutions. the solution to –(y + 6) = 2 will be also be a solution to the given absolute value equation. the solution(s) will be the number(s) on the number line 2 units away from –6. the value of y must be positive since the variable is inside absolute value signs.
Answers: 1
Mathematics, 21.06.2019 23:30, adriandehoyos1p3hpwc
Write the percent as a fraction or mixed number in simplest form. 0.8%
Answers: 2
Do you know the correct answer?
The graph below shows a company's profit f(x), in dollars, depending on the price of pencils x, in d...
Questions in other subjects:

English, 06.10.2019 19:40

Biology, 06.10.2019 19:40

Social Studies, 06.10.2019 19:40

Physics, 06.10.2019 19:40


