

Mathematics, 30.10.2020 05:10, Brittany0512
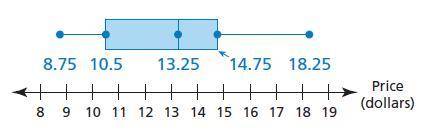
The box-and-whisker plot represents the prices (in dollars) of the entrees at a restaurant.
a. Find and interpret the range of the data.
The range is
The prices vary by no more than | |$
b. Describe the distribution of the data.
The lower 25% of the prices are between | |$
and | |$
the middle 50% of the prices are between | |$
and | |$
and the upper 25% of the prices are between | |$
and | |$
c. Find and interpret the interquartile range of the data.
The interquartile range is
The middle half of the prices vary by no more than | |$

Answers: 1


Other questions on the subject: Mathematics
Mathematics, 21.06.2019 18:00, phillipsk5480
Express in the simplest form: (x^2+9x+14/x^2-49) / (3x+6/x^2+x-56)
Answers: 3
Mathematics, 21.06.2019 18:30, ashleytellez
41/17 as a decimal rounded to the nearest hundredth
Answers: 1
Mathematics, 21.06.2019 20:00, anthonybowie99
Write the point-slope form of the line passing through (2, -12) and parallel to y=3x.
Answers: 3
Do you know the correct answer?
The box-and-whisker plot represents the prices (in dollars) of the entrees at a restaurant.
a. Find...
Questions in other subjects:
Mathematics, 06.05.2020 06:20

Mathematics, 06.05.2020 06:20


English, 06.05.2020 06:20

Mathematics, 06.05.2020 06:20


