

Mathematics, 30.10.2020 01:00, jerali
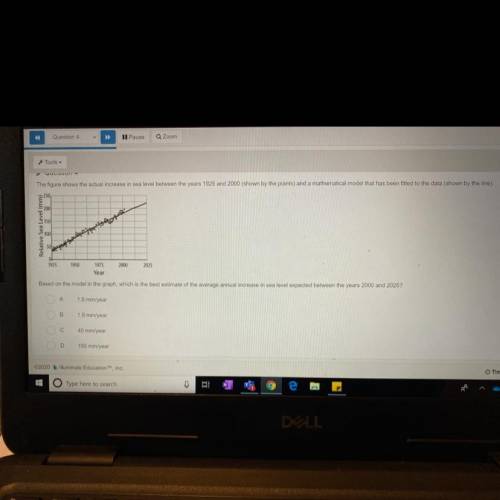
Based on the model in the graph, which is the best estimate of the average annual increase in sea level expected between the years 2000 and 2025?
1.6 mm/year
B
1.9 mm/year
С
40 mm/year
D
150 mm/year
2020 Muminate Education, Inc.

Answers: 2


Other questions on the subject: Mathematics
Mathematics, 21.06.2019 15:20, gibbss80stu
Find the image of a(4, -2) after it is reflected over the line y= 2, then reflected over the line x = 2. (-8,6) o (0.-2) o (0,6) (-8, -2)
Answers: 1
Mathematics, 21.06.2019 17:20, garciavergaraana
Which of these equations, when solved, gives a different value of x than the other three? a9.1 = -0.2x + 10 b10 = 9.1 + 0.2x c10 – 0.2x = 9.1 d9.1 – 10 = 0.2x
Answers: 1
Mathematics, 21.06.2019 21:00, manasangreddy2921
Simplify -4z+2y-y+-18z a.-22z+y b.-14z+2 c.3y+22z d. y +14z
Answers: 1
Mathematics, 21.06.2019 23:00, gisellekatherine1
The equation represents the function f, and the graph represents the function g. f(x)=3(5/2)^x determine the relationship between the growth factors of f and g. a. the growth factor of g is twice the growth factor of f. b. the growth factor of f is twice the growth factor of g. c. the growth factor of f is 2.5 times the growth factor of g. d. the growth factor of f is the same as the growth factor of g.
Answers: 3
Do you know the correct answer?
Based on the model in the graph, which is the best estimate of the average annual increase in sea le...
Questions in other subjects:
Mathematics, 20.02.2020 19:16

Chemistry, 20.02.2020 19:16

Mathematics, 20.02.2020 19:17

History, 20.02.2020 19:17
Mathematics, 20.02.2020 19:17


