


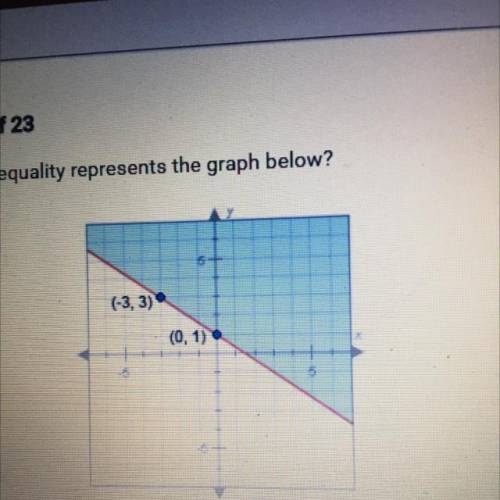
Which linear inequality represents the graph below?
A. 12-x+1
B. y> -*x+1
C. y24x+1<...

Mathematics, 29.10.2020 17:20, ayoismeisjjjjuan
Which linear inequality represents the graph below?
A. 12-x+1
B. y> -*x+1
C. y24x+1
D. y> 5x+

Answers: 3
Other questions on the subject: Mathematics
Mathematics, 21.06.2019 19:30, MagicDragon4734
Which of the points a(6, 2), b(0, 0), c(3, 2), d(−12, 8), e(−12, −8) belong to the graph of direct variation y= 2/3 x?
Answers: 2
Do you know the correct answer?
Questions in other subjects:
Mathematics, 02.11.2019 12:31

English, 02.11.2019 12:31


