


25
The graph models the proportional relationship between the amount of money
Tessa earns and...

Mathematics, 27.10.2020 20:30, marahkotelman
25
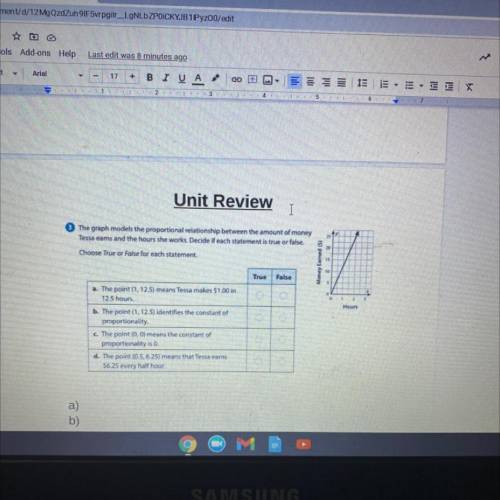
The graph models the proportional relationship between the amount of money
Tessa earns and the hours she works. Decide if each statement is true or false.
Choose True or False for each statement
20
15
Money Earned (5)
10
True
False
1
2
3
Hours
a. The point (1, 12.5) means Tessa makes $1.00 in
12.5 hours
b. The point (1, 12.5) identifies the constant of
proportionality
c. The point (0,0) means the constant of
proportionality is o.
d. The point (0.5, 6.25) means that Tessa earns
56.25 every half hour.

Answers: 2
Other questions on the subject: Mathematics
Mathematics, 20.06.2019 18:04, elijahjoyner20
1. convert. simplify your answer and write it as a proper fraction or as a whole or as a mixed number.4oz =_ pounds2. what is 1/3 of 66for both show work.
Answers: 1
Mathematics, 21.06.2019 16:00, ericavasquez824
The graph shows the distance y, in inches, a pendulum moves to the right (positive displacement) and to the left (negative displacement), for a given number of seconds x. how many seconds are required for the pendulum to move from its resting position and return? enter your answer in the box.
Answers: 2
Mathematics, 21.06.2019 17:00, ruslffdr
Arestaurant offers a $12 dinner special that has 5 choices for an appetizer, 12 choices for an entrée, and 4 choices for a dessert. how many different meals are available when you select an appetizer, an entrée, and a dessert? a meal can be chosen in nothing ways. (type a whole number.)
Answers: 1
Mathematics, 21.06.2019 21:30, kameronstebbins
High school seniors with strong academic records apply to the nation’s most selective colleges in greater numbers each year. because the number of slots remains relatively stable, some colleges reject more early applicants. suppose that for a recent admissions class, an ivy league college received 2851 applications for early admission. of this group, it admitted 1033 students early, rejected 854 outright, and deferred 964 to the regular admission pool for further consideration. in the past, this school has admitted 18% of the deferred early admission applicants during the regular admission process. counting the students admitted early and the students admitted during the regular admission process, the total class size was 2375. let e, r, and d represent the events that a student who applies for early admission is admitted early, rejected outright, or deferred to the regular admissions pool. suppose a student applies for early admission. what is the probability that the student will be admitted for early admission or be deferred and later admitted during the regular admission process?
Answers: 3
Do you know the correct answer?
Questions in other subjects:

Mathematics, 07.07.2021 01:00

Chemistry, 07.07.2021 01:00
Chemistry, 07.07.2021 01:00
Chemistry, 07.07.2021 01:00

Mathematics, 07.07.2021 01:00
Health, 07.07.2021 01:00


