

Mathematics, 27.10.2020 02:10, sabrinabowers1002
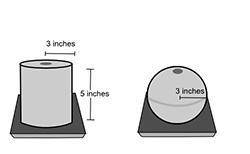
Bill used candle molds, as shown, to make candles that were perfect cylinders and spheres:
What is the approximate difference in the amount of wax needed to make a candle from each of these molds? (Use π = 3.14.)
21.0 cubic inches
28.26 cubic inches
52.55 cubic inches
66.0 cubic inches

Answers: 1


Other questions on the subject: Mathematics
Mathematics, 21.06.2019 14:00, sbelgirl2000
Question 3 of 30 paul buys fruit to make smoothies. he buys 3.78 pounds of apples, 2.12 pounds of peaches, and 4.45 pounds of oranges. paul rounds each weight to the nearest tenth of a pound. about how many pounds of fruit did paul buy? (a) 10.5 pounds (b) 10.2 pounds (c) 10.4 pounds (d) 10.0 pounds 30 points
Answers: 2
Mathematics, 21.06.2019 16:00, kell22wolf
Part one: measurements 1. measure your own height and arm span (from finger-tip to finger-tip) in inches. you will likely need some from a parent, guardian, or sibling to get accurate measurements. record your measurements on the "data record" document. use the "data record" to you complete part two of this project. name relationship to student x height in inches y arm span in inches archie dad 72 72 ginelle mom 65 66 sarah sister 64 65 meleah sister 66 3/4 67 rachel sister 53 1/2 53 emily auntie 66 1/2 66 hannah myself 66 1/2 69 part two: representation of data with plots 1. using graphing software of your choice, create a scatter plot of your data. predict the line of best fit, and sketch it on your graph. part three: the line of best fit include your scatter plot and the answers to the following questions in your word processing document 1. 1. which variable did you plot on the x-axis, and which variable did you plot on the y-axis? explain why you assigned the variables in that way. 2. write the equation of the line of best fit using the slope-intercept formula $y = mx + b$. show all your work, including the points used to determine the slope and how the equation was determined. 3. what does the slope of the line represent within the context of your graph? what does the y-intercept represent? 5. use the line of best fit to you to describe the data correlation.
Answers: 2
Mathematics, 21.06.2019 17:10, ohartshorn3670
Consider the functions below. function 1 function 2 function 3 select the statement which is true about the functions over the interval [1, 2] a b function 3 has the highest average rate of change function 2 and function 3 have the same average rate of change. function and function 3 have the same average rate of change function 2 has the lowest average rate of change d.
Answers: 3
Do you know the correct answer?
Bill used candle molds, as shown, to make candles that were perfect cylinders and spheres:
What is...
Questions in other subjects:


Social Studies, 17.09.2019 21:30

Mathematics, 17.09.2019 21:30
History, 17.09.2019 21:30


Biology, 17.09.2019 21:30
Mathematics, 17.09.2019 21:30

English, 17.09.2019 21:30


