


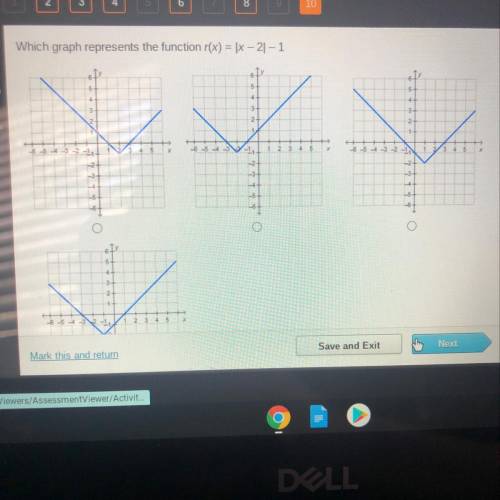
Which graph represents the function r(x) = \-21-1
D
5
3-
2
-5 - -
-5...

Mathematics, 22.10.2020 01:01, hrcatena
Which graph represents the function r(x) = \-21-1
D
5
3-
2
-5 - -
-5 -5 -3
1
5-5-3-2-117
3
4
1
61
5
4
3+
2+
1+
-65 +32-1
1 2 3 4 5

Answers: 3
Other questions on the subject: Mathematics
Mathematics, 21.06.2019 17:50, amcdonald009
To solve the system of equations below, grace isolated the variable y in the first equation and then substituted into the second equation. what was the resulting equation? 3y=12x x^2/4+y^2/9=1
Answers: 1
Mathematics, 21.06.2019 23:30, reycaden
The number of members f(x) in a local swimming club increased by 30% every year over a period of x years. the function below shows the relationship between f(x) and x: f(x) = 10(1.3)xwhich of the following graphs best represents the function? graph of f of x equals 1.3 multiplied by 10 to the power of x graph of exponential function going up from left to right in quadrant 1 through the point 0, 0 and continuing towards infinity graph of f of x equals 10 multiplied by 1.3 to the power of x graph of f of x equals 1.3 to the power of x
Answers: 1
Mathematics, 22.06.2019 00:00, enevjordan
What is 617.3 miles and each gallon of gas the car can travel 41 miles select a reasonable estimate of the number of gallons of gas karl used.
Answers: 1
Do you know the correct answer?
Questions in other subjects:

Mathematics, 17.10.2020 08:01

Physics, 17.10.2020 08:01

Biology, 17.10.2020 08:01
Mathematics, 17.10.2020 08:01


