


A number line graph is shown:
-8 -7 -6 -5 -4 -3 -2 -1 0 1 2 3 4 5 6 7 8
Based on the graph, w...

Mathematics, 21.10.2020 20:01, mimi19374
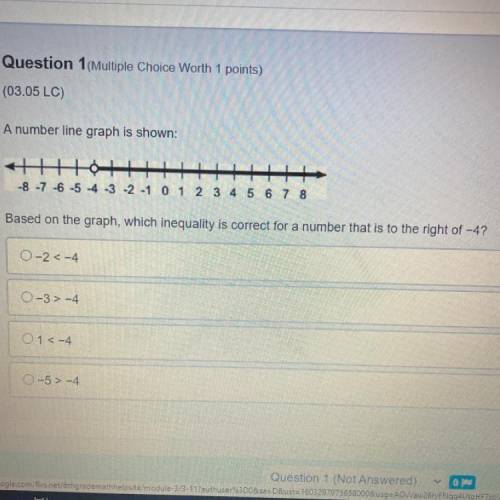
A number line graph is shown:
-8 -7 -6 -5 -4 -3 -2 -1 0 1 2 3 4 5 6 7 8
Based on the graph, which inequality is correct for a number that is to the right of -4?
0-2 <-4
O-3>-4
0 1 <-4
-5 >-4

Answers: 1
Other questions on the subject: Mathematics
Mathematics, 21.06.2019 17:10, ivilkas23
The frequency table shows a set of data collected by a doctor for adult patients who were diagnosed with a strain of influenza. patients with influenza age range number of sick patients 25 to 29 30 to 34 35 to 39 40 to 45 which dot plot could represent the same data as the frequency table? patients with flu
Answers: 2
Mathematics, 21.06.2019 20:30, velazquezemmy45
Aswimming pool measures 22ft by 12ft and is 4ft deep. if the pool is being filled at 2.5 cubic ft per minute, how long will it take to fill the pool?
Answers: 1
Do you know the correct answer?
Questions in other subjects:

Mathematics, 04.01.2022 14:00

Health, 04.01.2022 14:00


SAT, 04.01.2022 14:00
Mathematics, 04.01.2022 14:00

Advanced Placement (AP), 04.01.2022 14:00
SAT, 04.01.2022 14:00


