

Mathematics, 20.10.2020 18:01, esmeraldavelez63
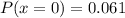
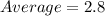
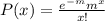
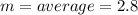
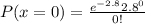
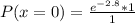
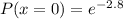
Arrivals at a parking lot are assumed to follow the Poisson distribution. The average arrival rate is 2.8 per minute. What is the probability that during a given minute no cars will arrive

Answers: 1


Other questions on the subject: Mathematics
Mathematics, 21.06.2019 21:40, chunkymonkey090
Ihonestly have no clue if it's each or none.
Answers: 1
Mathematics, 22.06.2019 01:00, s27511583
The weight of 46 new patients of a clinic from the year 2018 are recorded and listed below. construct a frequency distribution, using 7 classes. then, draw a histogram, a frequency polygon, and an ogive for the data, using the relative information from the frequency table for each of the graphs. describe the shape of the histogram. data set: 130 192 145 97 100 122 210 132 107 95 210 128 193 208 118 196 130 178 187 240 90 126 98 194 115 212 110 225 187 133 220 218 110 104 201 120 183 124 261 270 108 160 203 210 191 180 1) complete the frequency distribution table below (add as many rows as needed): - class limits - class boundaries - midpoint - frequency - cumulative frequency 2) histogram 3) frequency polygon 4) ogive
Answers: 1
Do you know the correct answer?
Arrivals at a parking lot are assumed to follow the Poisson distribution. The average arrival rate i...
Questions in other subjects:

History, 02.12.2021 07:10

Mathematics, 02.12.2021 07:10
Mathematics, 02.12.2021 07:10
History, 02.12.2021 07:10
History, 02.12.2021 07:10


