

Mathematics, 20.10.2020 09:01, gabrielaperezcz
I. Collect data from several fast food chains on the number of fat calories and grams of saturated fat in menu items. Record at least 12 ordered pairs of (fat calories, grams of saturated fat). Organize your data in a table.
II. Make a scatter plot of the data on graph paper. Be sure to label the axes and use an appropriate title for the graph.
You may wish to use a graphing calculator, spread sheet, or other technology resource (such as the graphing utility link below) to aid you in graphing.
Create a Graph
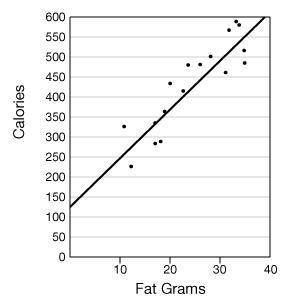
III. Draw a trend line for the scatter plot. Use the following scatter plot of the ordered pairs (fat grams, total calories) as an example.
IV. Calculate the slope of the trend line. (Choose two points on the line and find vertical change over horizontal change.)
Note: Graphing calculators and spread sheets have features with which to draw trend lines and determine the equation. You may choose to use one of these options. If you use technology, indicate what steps were taken to arrive at your equation.
V. Using the slope and y-intercept, write the equation of the trend line ( y = mx + b).
VI. Choose a "calories from fat" value that is not in your collected data set and that is at least 10 fat calories away from any collected value. Use the equation calculated in step V to predict the number of fat grams in an item having that number of fat calories. Be sure to show your work.
VII. Search for an item in a fast food menu having the same number of fat calories as the one you chose above. (If you cannot find the exact value, get as close as you can.) Compare the calculated value from step VI to this actual value. Explain why (or why not) you would have expected your prediction (calculated value) to be close to the actual value.

Answers: 3


Other questions on the subject: Mathematics
Mathematics, 21.06.2019 15:00, khloenm309
Δabc is reflected across line l to form δ alblcl, and a¯¯¯al¯¯¯¯ intersects line l at point d. which equation is not necessarily true?
Answers: 1
Mathematics, 21.06.2019 16:30, jimyyyy
Which composition of similarity transformations maps polygon abcd to polygon a'b'c'd'? a dilation with a scale factor less than 1 and then a reflection a dilation with a scale factor less than 1 and then a translation a dilation with a scale factor greater than 1 and then a reflection a dilation with a scale factor greater than 1 and then a translation
Answers: 3
Mathematics, 21.06.2019 18:00, ijustneedhelp29
What does the relationship between the mean and median reveal about the shape of the data
Answers: 1
Do you know the correct answer?
I. Collect data from several fast food chains on the number of fat calories and grams of saturated f...
Questions in other subjects:

English, 23.07.2021 03:50
Mathematics, 23.07.2021 03:50


Computers and Technology, 23.07.2021 03:50


