

Mathematics, 20.10.2020 04:01, shyiann7910
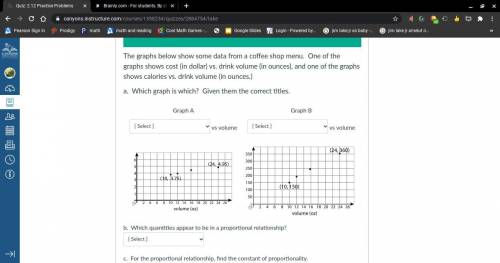
The graphs below show some data from a coffee shop menu. One of the graphs shows cost (in dollar) vs. drink volume (in ounces), and one of the graphs shows calories vs. drink volume (in ounces.)
a. Which graph is which? Given them the correct titles.
Graph A: _vs volume. Graph B:_vs volume
b. Which quantities appear to be in a proportional relationship?
1. cost vs volume or
2. calories vs volume
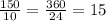
For the proportional relationship, find the constant of proportionality.
a. 0.21 per ounce,
b. 12 calories per ounce,
c. 0.38$ per ounce, or
d. 15 calories per ounce

Answers: 3


Other questions on the subject: Mathematics
Mathematics, 21.06.2019 13:40, Valduarte07
Solve the equation 3x2 + 19x + 9 = 0 to the nearest tenth.
Answers: 1
Mathematics, 21.06.2019 19:30, andrwisawesome0
Suzanne began a trip with 18 1/2 gallons of gas in the gas tank of her car if she hughes 17 3/4 gallons on the trip how many gallons does she have left once she finish the trip
Answers: 1
Mathematics, 21.06.2019 20:00, Yumimiku5989
Which number completes the inequality? 2/3 < _ < 7/9
Answers: 1
Mathematics, 21.06.2019 21:30, drepeter86
50 people men and women were asked if they watched at least one sport on tv. 20 of the people surveyed are women, but only 9 of them watch at least one sport on tv. 16 of the men watch at least one sport on tv. make a a two-way table and a relative frequency table to represent the data.
Answers: 3
Do you know the correct answer?
The graphs below show some data from a coffee shop menu. One of the graphs shows cost (in dollar) vs...
Questions in other subjects:

English, 08.10.2021 17:30

Spanish, 08.10.2021 17:30
English, 08.10.2021 17:30

Physics, 08.10.2021 17:30

Mathematics, 08.10.2021 17:30
Spanish, 08.10.2021 17:30


