

Mathematics, 20.10.2020 04:01, dariel41
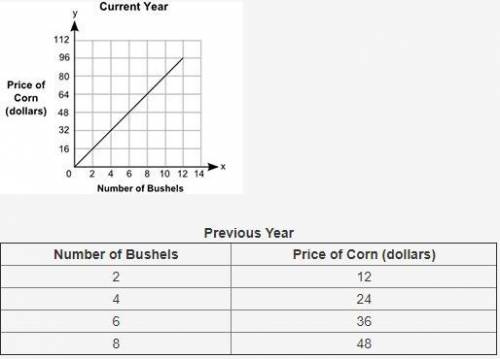
The graph shows the prices of different numbers of bushels of corn at a store in the current year. The table shows the prices of different numbers of bushels of corn at the same store in the previous year.
A graph shows Number of Bushels on x-axis and Price of Corn in dollars on y-axis. The x-axis scale is shown from 0 to 14 at increments of 2, and the y-axis scale is shown from 0 to 112 at increments of 16. A straight line joins the ordered pairs 2, 16 and 4, 32 and 6, 48 and 8, 64 and 10, 80 and 12, 96.
Previous Year
Number of Bushels
Price of Corn (dollars)
2
12
4
24
6
36
8
48
Part A: Describe in words how you can find the rate of change of a bushel of corn in the current year, and find the value. (5 points)
Part B: How many dollars more is the price of a bushel of corn in the current year than the price of a bushel of corn in the previous year? Show your work. (5 points)

Answers: 3


Other questions on the subject: Mathematics
Mathematics, 22.06.2019 00:30, benchang3621
Find the values of the variables and the lengths of the sides of this kite.
Answers: 3
Mathematics, 22.06.2019 03:00, logsdonella
If bill bought a home for $210,000 and he sold it a year later for $120,000 his percentage of loss is
Answers: 2
Do you know the correct answer?
The graph shows the prices of different numbers of bushels of corn at a store in the current year. T...
Questions in other subjects:


Biology, 23.04.2021 01:00


Mathematics, 23.04.2021 01:00
English, 23.04.2021 01:00
Biology, 23.04.2021 01:00

Social Studies, 23.04.2021 01:00
English, 23.04.2021 01:00


