
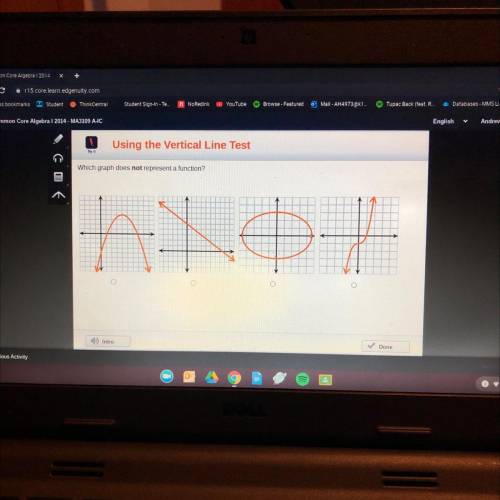


Which graph dose not represent a function
...

Answers: 2
Other questions on the subject: Mathematics

Mathematics, 21.06.2019 21:50, smithsa10630
What is the 17th term in the arithmetic sequence in which a6 is 101 and a9 is 83
Answers: 1
Mathematics, 22.06.2019 00:30, valdezangie10
Fiona has to plot a histogram of the given data
Answers: 1
Mathematics, 22.06.2019 01:10, IHeartDarkSide03
Time (minutes) amount of water (gallons) practice 1. jin fills up a 510-gallon pool in the backyard for her children. she fills it with the garden hose at a rate of 17 gallons per minute. after it is filled, she lets it sit for 30 minutes in order to let the water temperature rise. the children then get in and have fun for an hour. the pool loses about 5 gallon of water each minute due to their splashing and playing. at the end of the hour, they tear the pool while getting out, which causes a leak the pool then begins to lose water at a rate of 2 gallons per minute. a. complete the table to show the amount of water in the pool after each minute. b. create a graph to model the problem situation. include when the pool will be empty. c. write a piecewise function that models this problem situation. explain your reasoning for each piece of the function. d. identify the x- and y-intercept. explain what they mean in terms of the problem situation, atamantha a cul 80 100 120 150 200 ning, inc
Answers: 3
Mathematics, 22.06.2019 02:30, misk980
Atrain traveled for 1.5 hours to the first station, stopped for 30 minutes, then traveled for 4 hours to the final station where it stopped for 1 hour. the total distance traveled is a function of time. which graph most accurately represents this scenario? a graph is shown with the x-axis labeled time (in hours) and the y-axis labeled total distance (in miles). the line begins at the origin and moves upward for 1.5 hours. the line then continues upward at a slow rate until 2 hours. from 2 to 6 hours, the line continues quickly upward. from 6 to 7 hours, it moves downward until it touches the x-axis a graph is shown with the axis labeled time (in hours) and the y axis labeled total distance (in miles). a line is shown beginning at the origin. the line moves upward until 1.5 hours, then is a horizontal line until 2 hours. the line moves quickly upward again until 6 hours, and then is horizontal until 7 hours a graph is shown with the axis labeled time (in hours) and the y-axis labeled total distance (in miles). the line begins at the y-axis where y equals 125. it is horizontal until 1.5 hours, then moves downward until 2 hours where it touches the x-axis. the line moves upward until 6 hours and then moves downward until 7 hours where it touches the x-axis a graph is shown with the axis labeled time (in hours) and the y-axis labeled total distance (in miles). the line begins at y equals 125 and is horizontal for 1.5 hours. the line moves downward until 2 hours, then back up until 5.5 hours. the line is horizontal from 5.5 to 7 hours
Answers: 1
Do you know the correct answer?
Questions in other subjects:
Mathematics, 05.06.2021 14:00

English, 05.06.2021 14:00
Mathematics, 05.06.2021 14:00

History, 05.06.2021 14:00
English, 05.06.2021 14:00

Mathematics, 05.06.2021 14:00

Physics, 05.06.2021 14:00
English, 05.06.2021 14:00
Mathematics, 05.06.2021 14:00


