

Mathematics, 20.10.2020 03:01, taytay2912
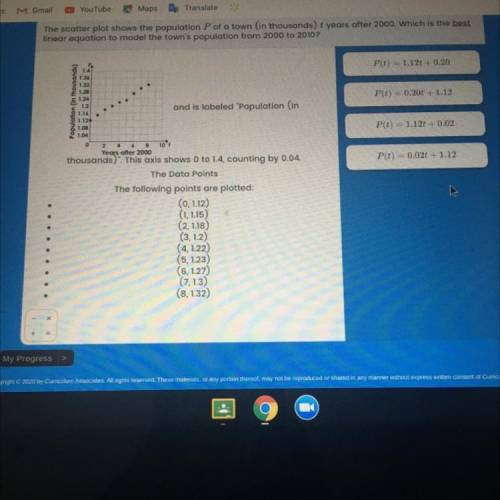
The scatter plot shows the population P of a town (in thousands) t years after 2000. Which is the best
linear equation to model the town's population from 2000 to 2010?
51
P(t) = 1.121 + 0.20
P(t) = 0.20 + 1.12
01.16 -
P(t) = 1.12 + 0.02
P(t) = 0.02t + 1.12
120
1.24
1.2
and is labeled "Population (in
1124
1.00
21.04
2
10
Years after 2000
thousands)". This axis shows 0 to 1.4, counting by 0.04.
The Data Points
The following points are plotted:
(0.1.12)
(1.1.15)
(2.1.18)
(3.1.2)
(4.1.22)
(5, 1.23)
(6. 1.27)
(7.1.3)
(8, 1.32)

Answers: 3


Other questions on the subject: Mathematics
Mathematics, 21.06.2019 15:00, cupcakes5335
Abcd is a parallelogram. the diagram is not drawn to scale. if m
Answers: 2
Mathematics, 21.06.2019 21:00, makayla10119
When george started his current job, his employer told him that at the end of the first year, he would receive two vacation days. after each year worked, his number of vacation days will double up to five work weeks (25days) of payed vacation. how many vacation days will he have in 4 years
Answers: 1
Mathematics, 21.06.2019 22:00, lokiliddel
In dire need~! describe how to use area models to find the quotient 2/3 divided by 1/5. check your work by also finding the quotient 2/3 divided by 1/5 using numerical operations only.
Answers: 3
Do you know the correct answer?
The scatter plot shows the population P of a town (in thousands) t years after 2000. Which is the be...
Questions in other subjects:

Mathematics, 22.04.2020 03:04

Social Studies, 22.04.2020 03:04


Mathematics, 22.04.2020 03:04


