Mathematics, 01.11.2019 16:31, jay0630
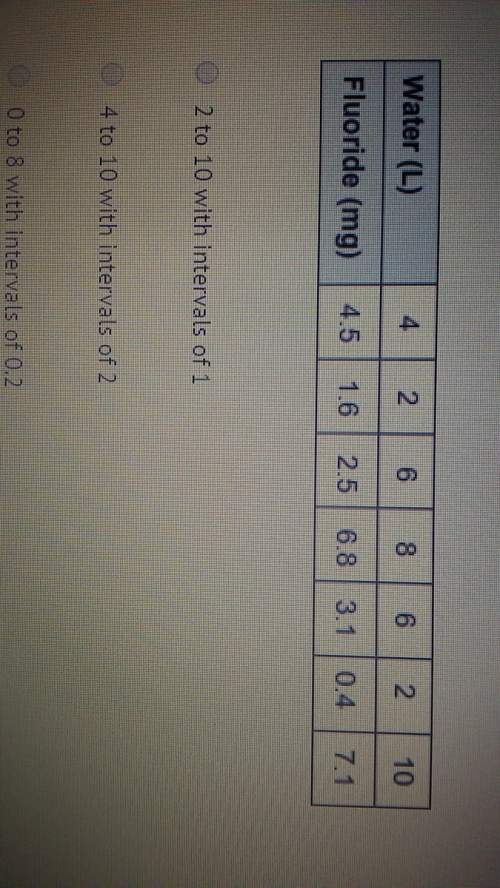
For making a scatter plot of the data set which would be the best scale and interval for the axis that represent the amount of fluorine?
a.2 to 10 with intervals of 1
b.4 to 10 with intervals of 2
c.0 to 8 with intervals of 0.2
d.0 to 8 with intervals of 4


Answers: 1
Other questions on the subject: Mathematics


Mathematics, 21.06.2019 20:20, oscarmasinde44
Abag contains 3 red marbles, 2 blue marbles, and 2 green marbles. one marble is picked, then another marble. assume that the selections are made with replacement. a) find the probability of picking two red marbles with replacement. b) find the probability of picking a red marble and a blue marble. assume the selections are made without replacement. c) find the probability of picking two red marbles without replacement. d) find the probability of picking a red marble and a blue marble without replacement.
Answers: 1

Mathematics, 21.06.2019 23:30, sandrafina2004
Sally deposited money into a savings account paying 4% simple interest per year. the first year, she earned $75 in interest. how much interest will she earn during the following year?
Answers: 2

Mathematics, 22.06.2019 00:20, tamekiablair502
Once george got to know adam, they found that they really liked each other. this is an example of what factor in friendship
Answers: 1
Do you know the correct answer?
For making a scatter plot of the data set which would be the best scale and interval for the axis th...
Questions in other subjects:

Chemistry, 15.12.2020 23:40

Mathematics, 15.12.2020 23:40

English, 15.12.2020 23:40

History, 15.12.2020 23:40


Mathematics, 15.12.2020 23:40

Mathematics, 15.12.2020 23:40


Biology, 15.12.2020 23:40


