


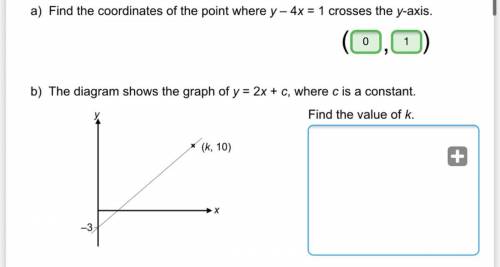
The diagram shows the graph of y=2x+c where c is the constant
...

Mathematics, 18.10.2020 21:01, dward5823
The diagram shows the graph of y=2x+c where c is the constant

Answers: 2
Other questions on the subject: Mathematics
Mathematics, 22.06.2019 03:00, ultimateknight8
There are a total sales of 2,000 dollars on monday on tuesday sales dropped 10% on wednesday sales dropped another 20% compared with tuesday from wednesday to thursday sales increases by an equal amount to 25% of monday total sales what is the net change in dollars on total sales from monday to tuesday
Answers: 1
Mathematics, 22.06.2019 06:40, chloebaby8
Select the undefined term that best defines the arrow pictured. point line plane
Answers: 1
Do you know the correct answer?
Questions in other subjects:


