


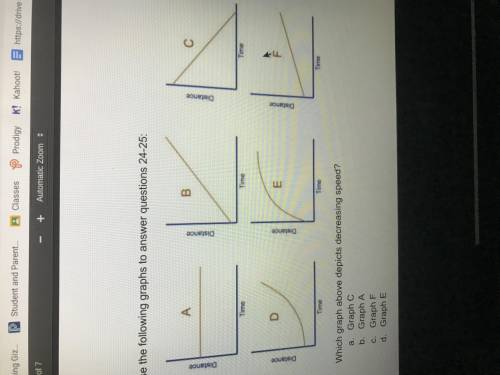
Which graph indicates decreasing speed?
A. Graph c
B Graph A
c graph F
d gr...

Mathematics, 17.10.2020 23:01, Rogeartest4
Which graph indicates decreasing speed?
A. Graph c
B Graph A
c graph F
d graph

Answers: 3
Other questions on the subject: Mathematics
Mathematics, 22.06.2019 02:00, Jeremiahcornelis
Yolanda wanted to buy a total of 6 pounds of mixed nuts and dried fruit for a party she paid 21.60 for mixed nuts and 11.90 for dried fruit did yolanda but enough mixed nuts and dried fruit for the party
Answers: 2
Mathematics, 22.06.2019 02:20, Amholloway13
Jenny invests $2,000 at an interest rate of 5%. the amount of money, me, in jenny's account after tyears can be represented using the equation ma-2000(1.05). if jenny would have invested the same amount of money at the same interest rate four years ago, the equation representing the amount of money mo. in her account would be represented using the equation! mg = 2000(105)*** which of the following is equivalent to mp? 2000(105) om- 1.05 2000(1.05) mo 1059 mp-2000(1.05) (105) mp - 2000(1.05) + (1.05)
Answers: 1
Do you know the correct answer?
Questions in other subjects:

History, 07.04.2021 16:10

Geography, 07.04.2021 16:10

English, 07.04.2021 16:10
Mathematics, 07.04.2021 16:10
English, 07.04.2021 16:10

Biology, 07.04.2021 16:10


