

Mathematics, 17.10.2020 14:01, DarkWolf983
The following table respresents the results of a survey of 20 students asked how many pictures they take with their smartphone each day to post to social media. Which histogram best represents this survey data?
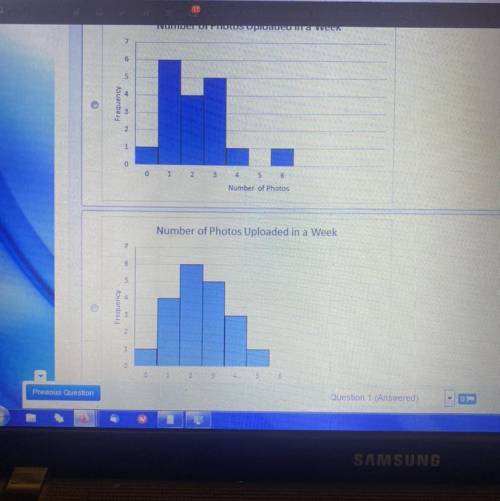

Answers: 3


Other questions on the subject: Mathematics
Mathematics, 21.06.2019 13:40, Valduarte07
Solve the equation 3x2 + 19x + 9 = 0 to the nearest tenth.
Answers: 1
Mathematics, 21.06.2019 21:30, brittanysanders
Lizette is training for a marathon. at 7: 00 she left her house and ran until 8: 30, then she walked until 11: 30. she covered a total distance of 18 miles. her running speed was six miles per hour faster than her walking speed. find her running and walking speeds in miles per hour.
Answers: 2
Do you know the correct answer?
The following table respresents the results of a survey of 20 students asked how many pictures they...
Questions in other subjects:


Mathematics, 10.09.2020 04:01
Mathematics, 10.09.2020 04:01


